ASP.NET Core Endpoint
ASP.NET Core endpoint metrics from OpenTelemetry
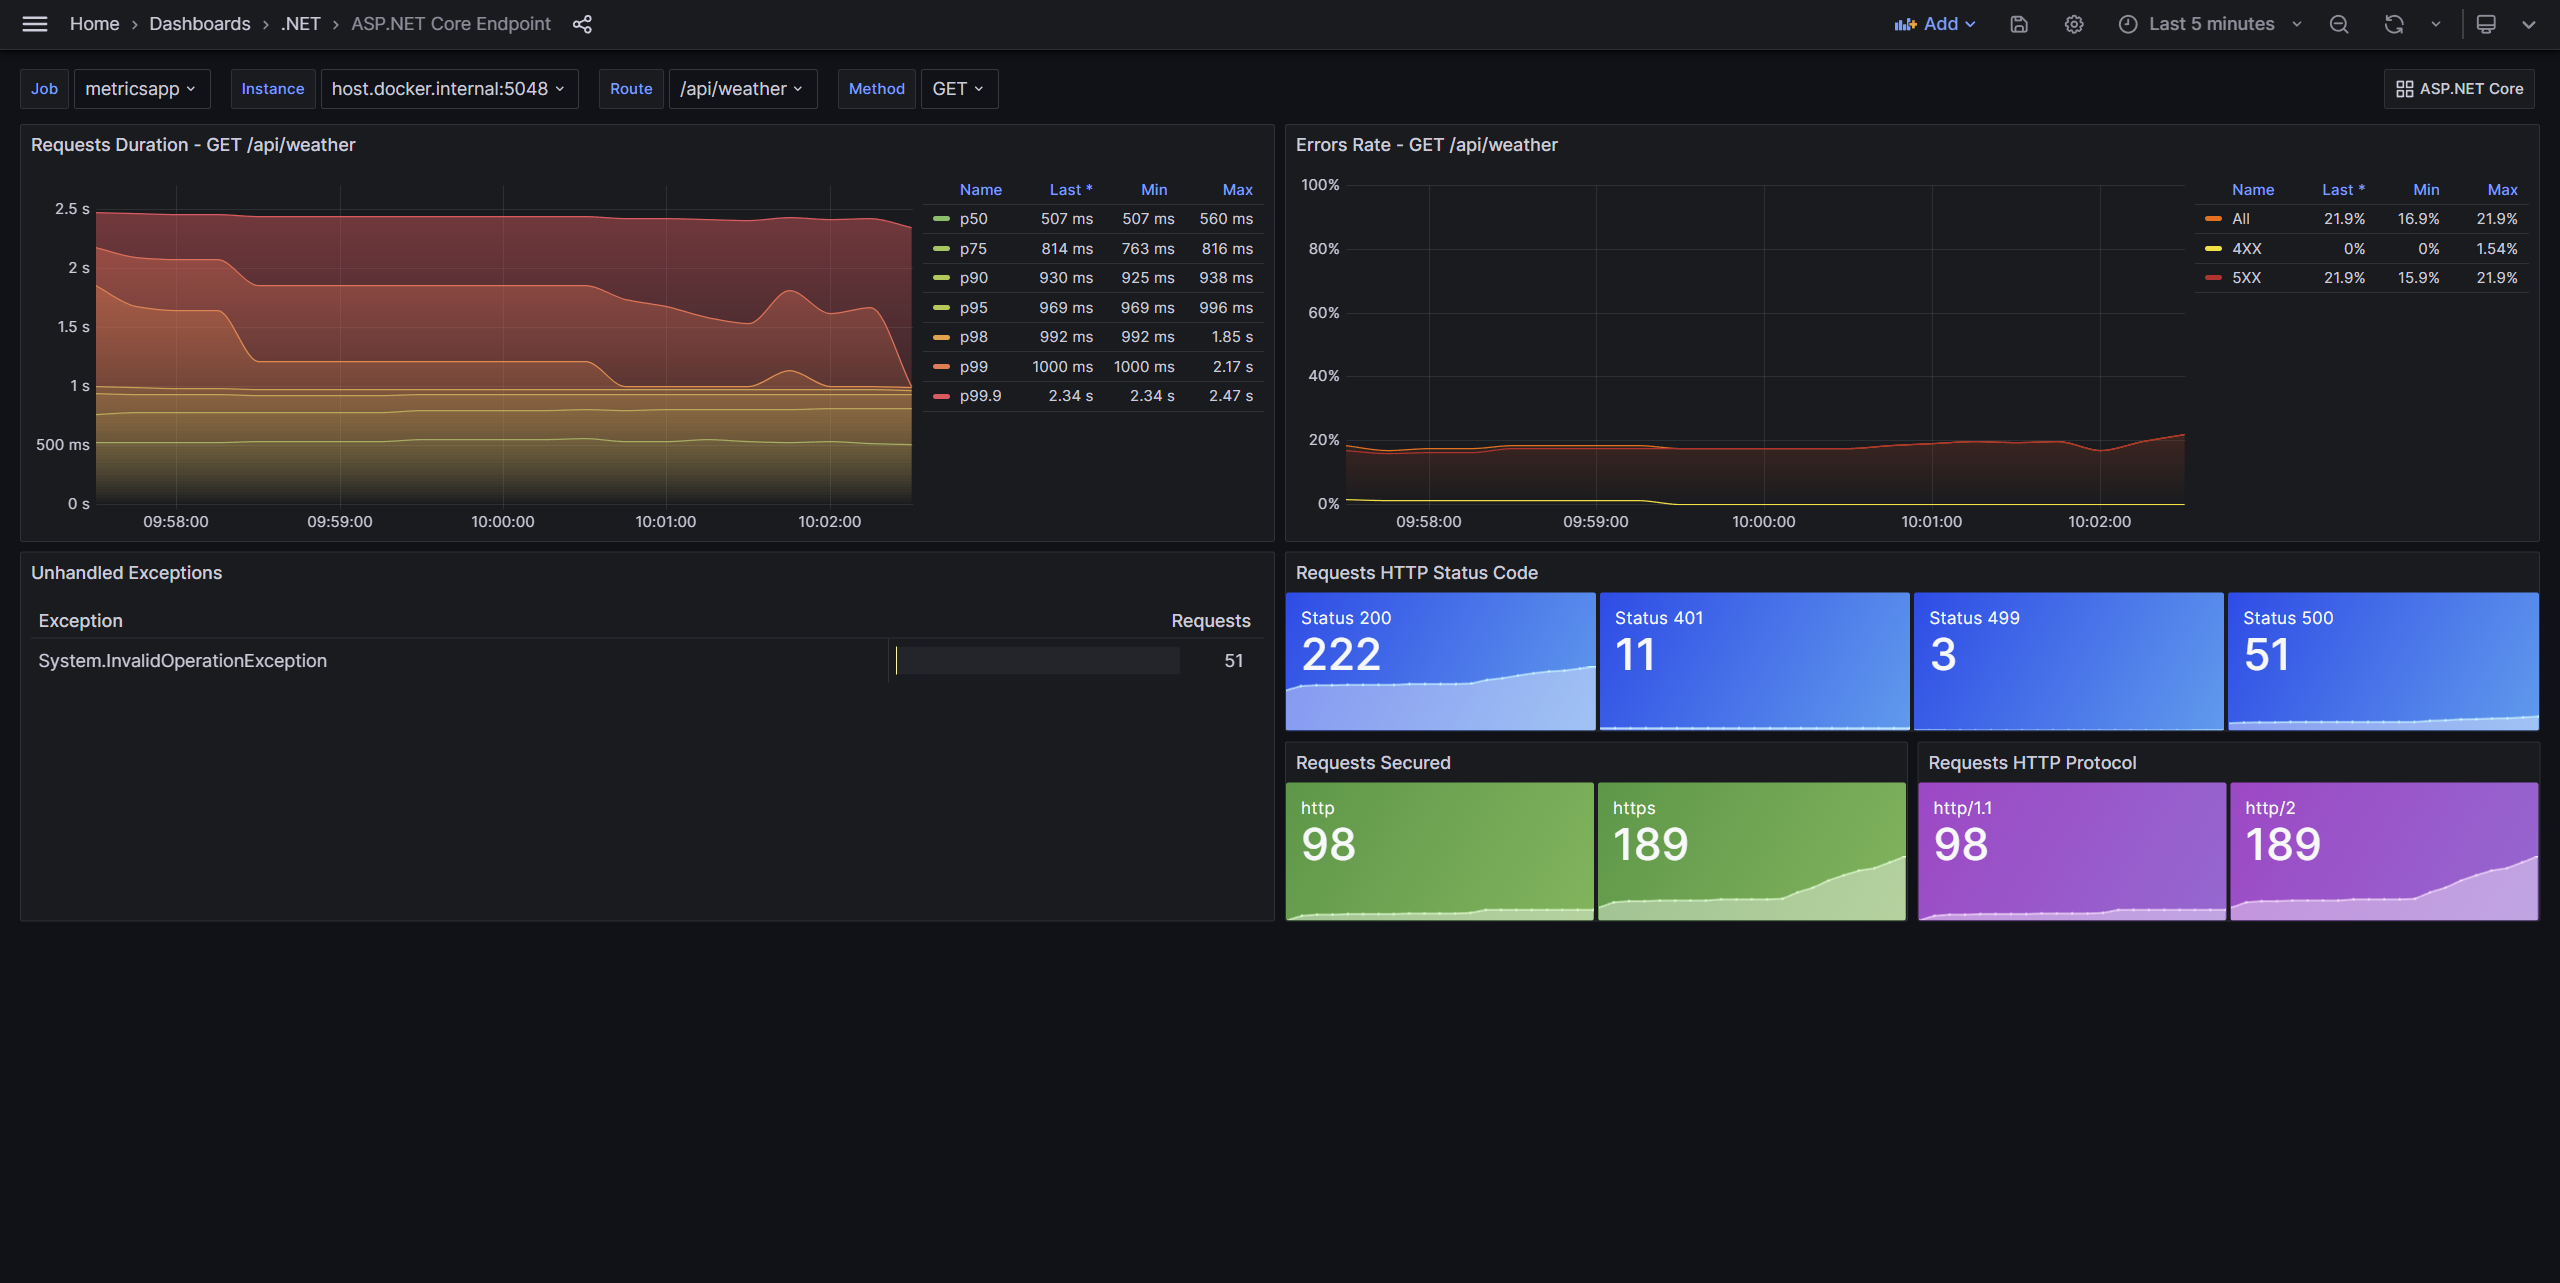
The ASP.NET Core endpoint dashboard provides detailed information about individual endpoints. This dashboard includes the most commonly used ASP.NET Core metrics.
Requires .NET 8 or later.
Data displayed:
- Request duration
- Error rate
- Unhandled exceptions
- Requests HTTP status code
- Requests secured
- Requests HTTP protocol
This dashboard can be used on its own or opened from links on the ASP.NET Core dashboard. Import both dashboards into Grafana for the best experience.
Data source config
Collector config:
Upload an updated version of an exported dashboard.json file from Grafana
| Revision | Description | Created | |
|---|---|---|---|
| Download |
Metrics Endpoint (Prometheus)
Easily monitor any Prometheus-compatible and publicly accessible metrics URL with Grafana Cloud's out-of-the-box monitoring solution.
Learn more