Laravel & Lumen Execution Time Monitoring
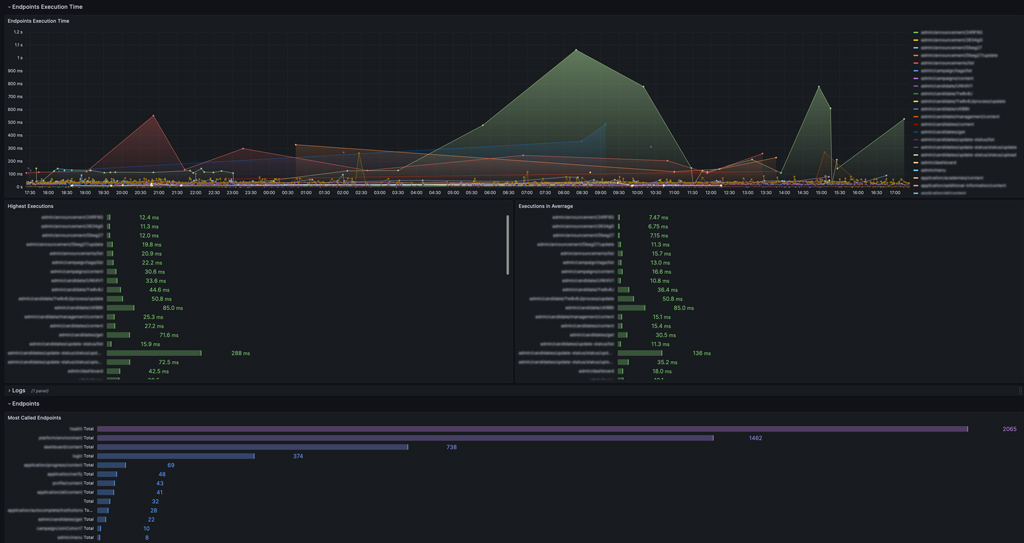
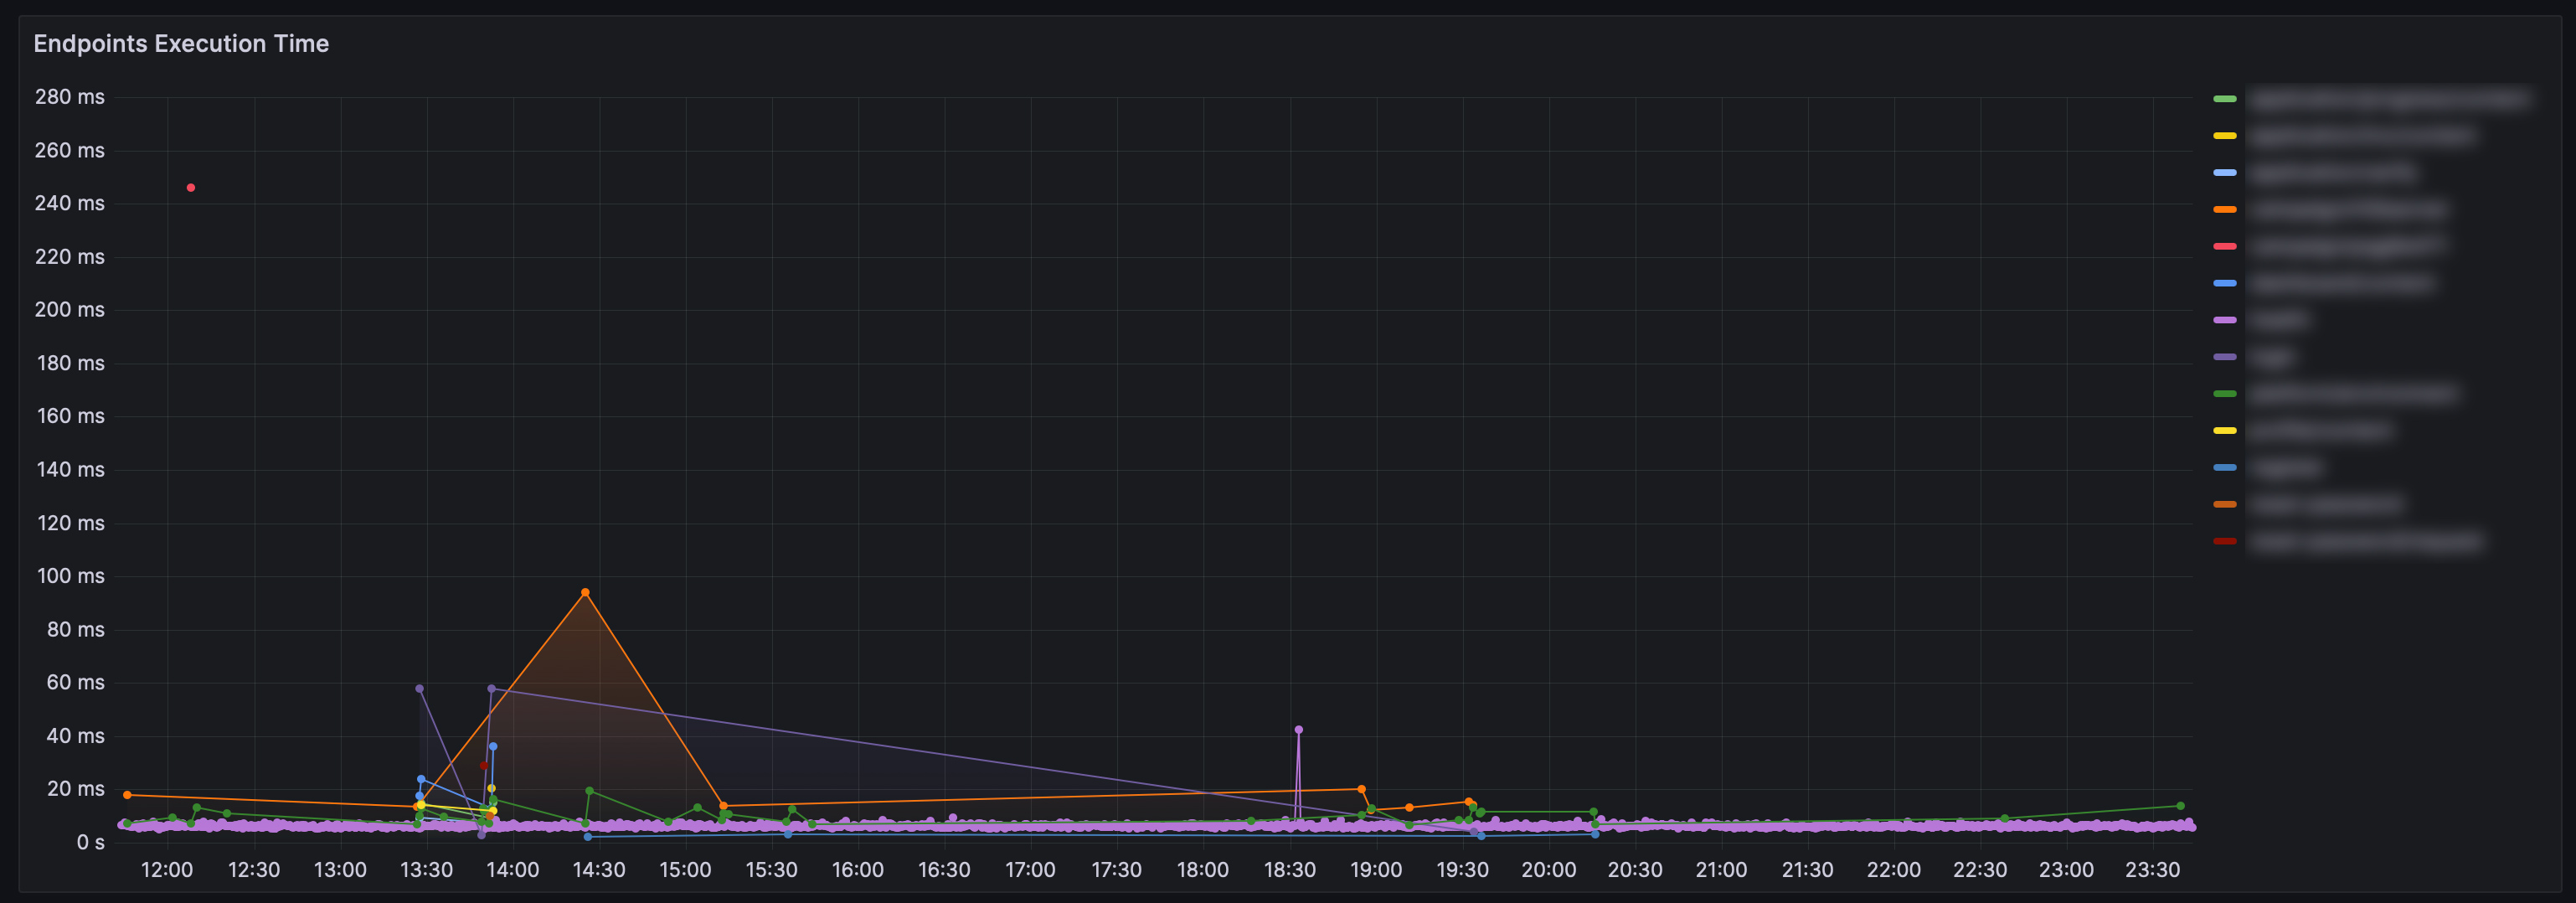
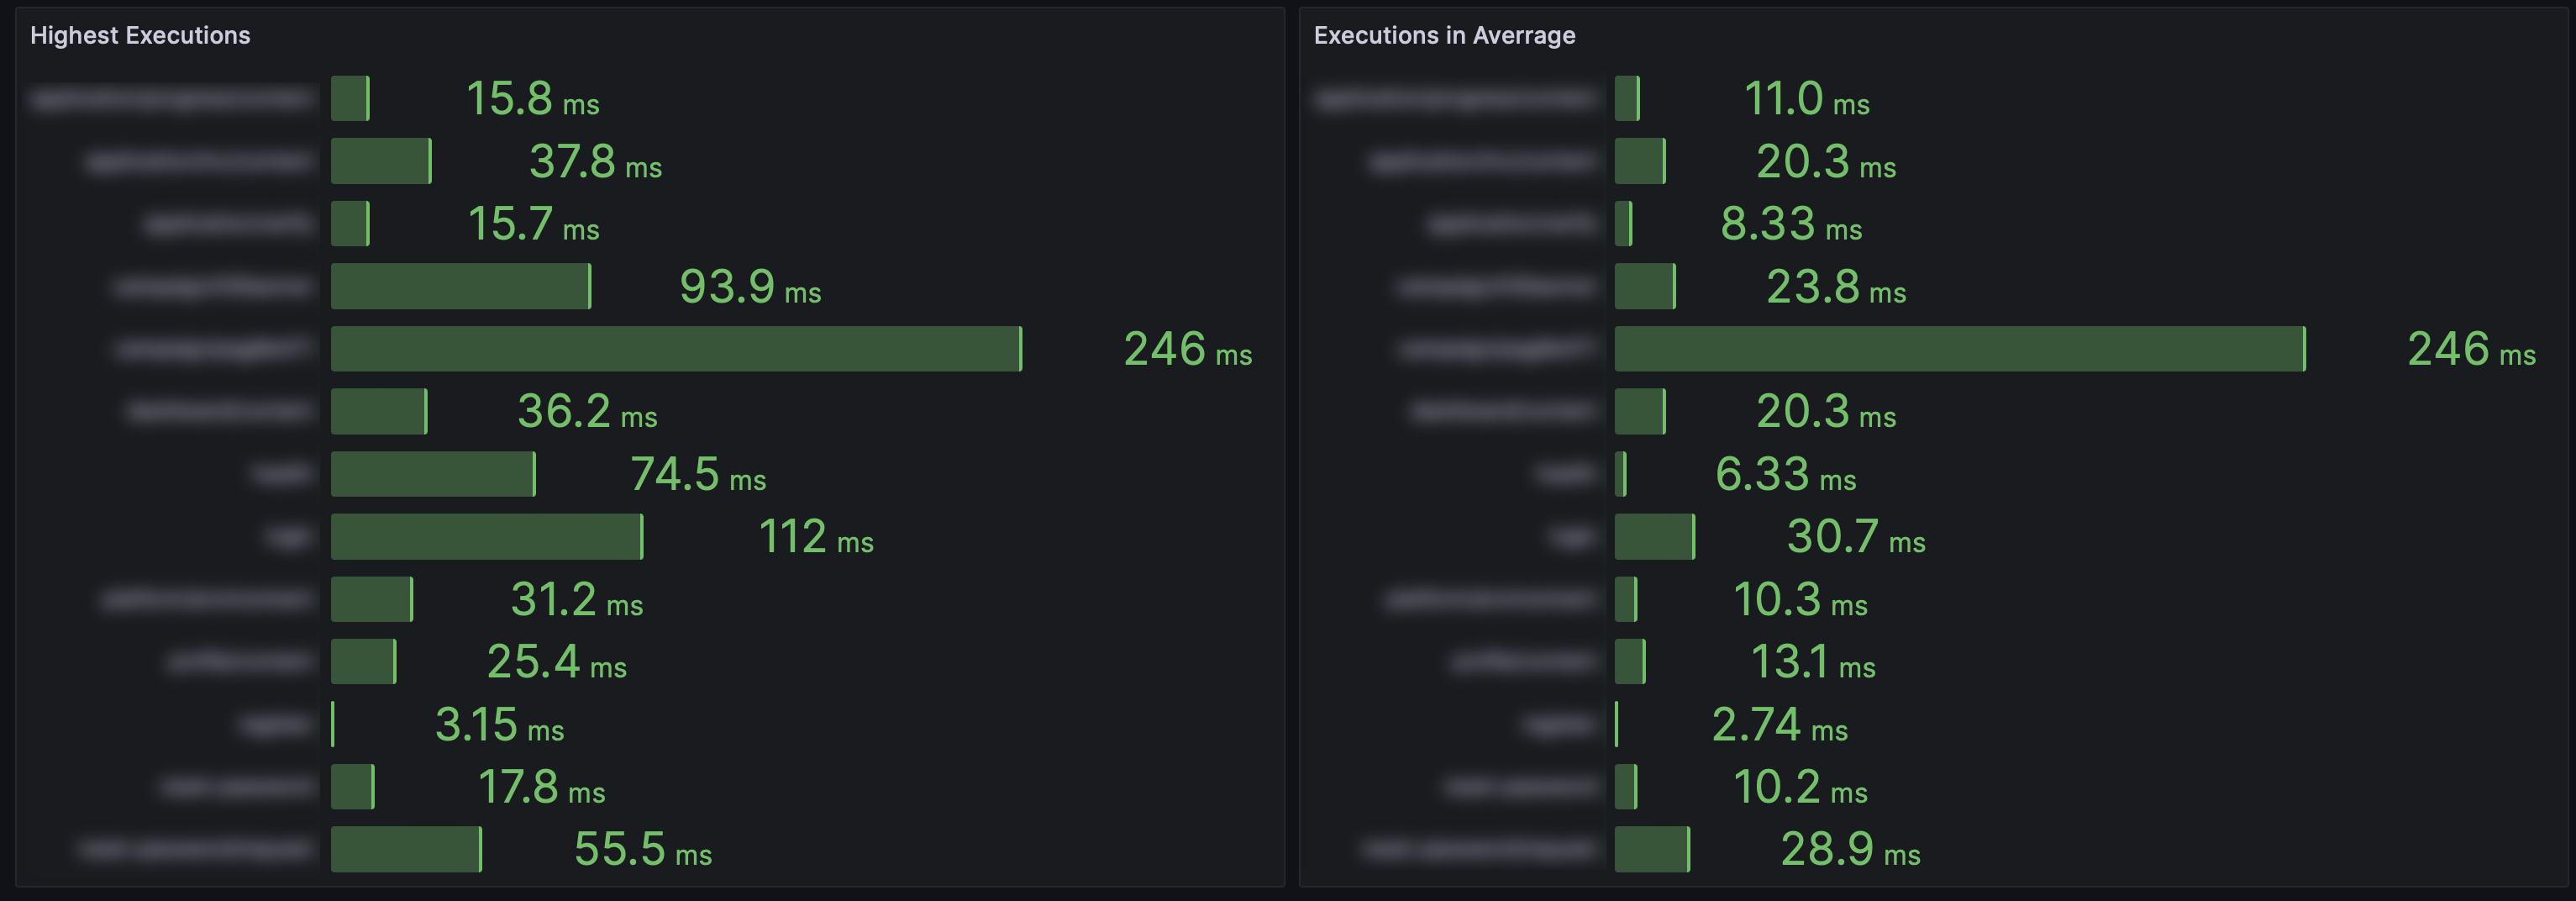
This dashboard will help you monitoring your Laravel/Lumen app's endpoints.
I've made this dashboard to help monitoring the execution time of a Laravel/Lumen API, so we can easily pinpoint the resource intensive endpoints and optimize them quickly.
This has been developed and tested using Lumen 10.
Here is the link to the tutorial I've made to help you preparing your Laravel app and setup the dashboard: I've made this dashboard to help monitoring the execution time of a Laravel/Lumen API, so we can easily pinpoint the resource intensive endpoints and optimize them quickly.
This has been developed and tested using Lumen 10.
Here is the link to the tutorial I've made to help you preparing your Laravel app and setup the dashboard: https://blog.buleedan.com/monitoring-api-endpoints-speed-on-laravel-lumen-using-loki-and-grafana-1-3/
Data source config
Collector config:
Upload an updated version of an exported dashboard.json file from Grafana
| Revision | Description | Created | |
|---|---|---|---|
| Download |


