Azure / Insights / Applications - Failures - 3. Exceptions
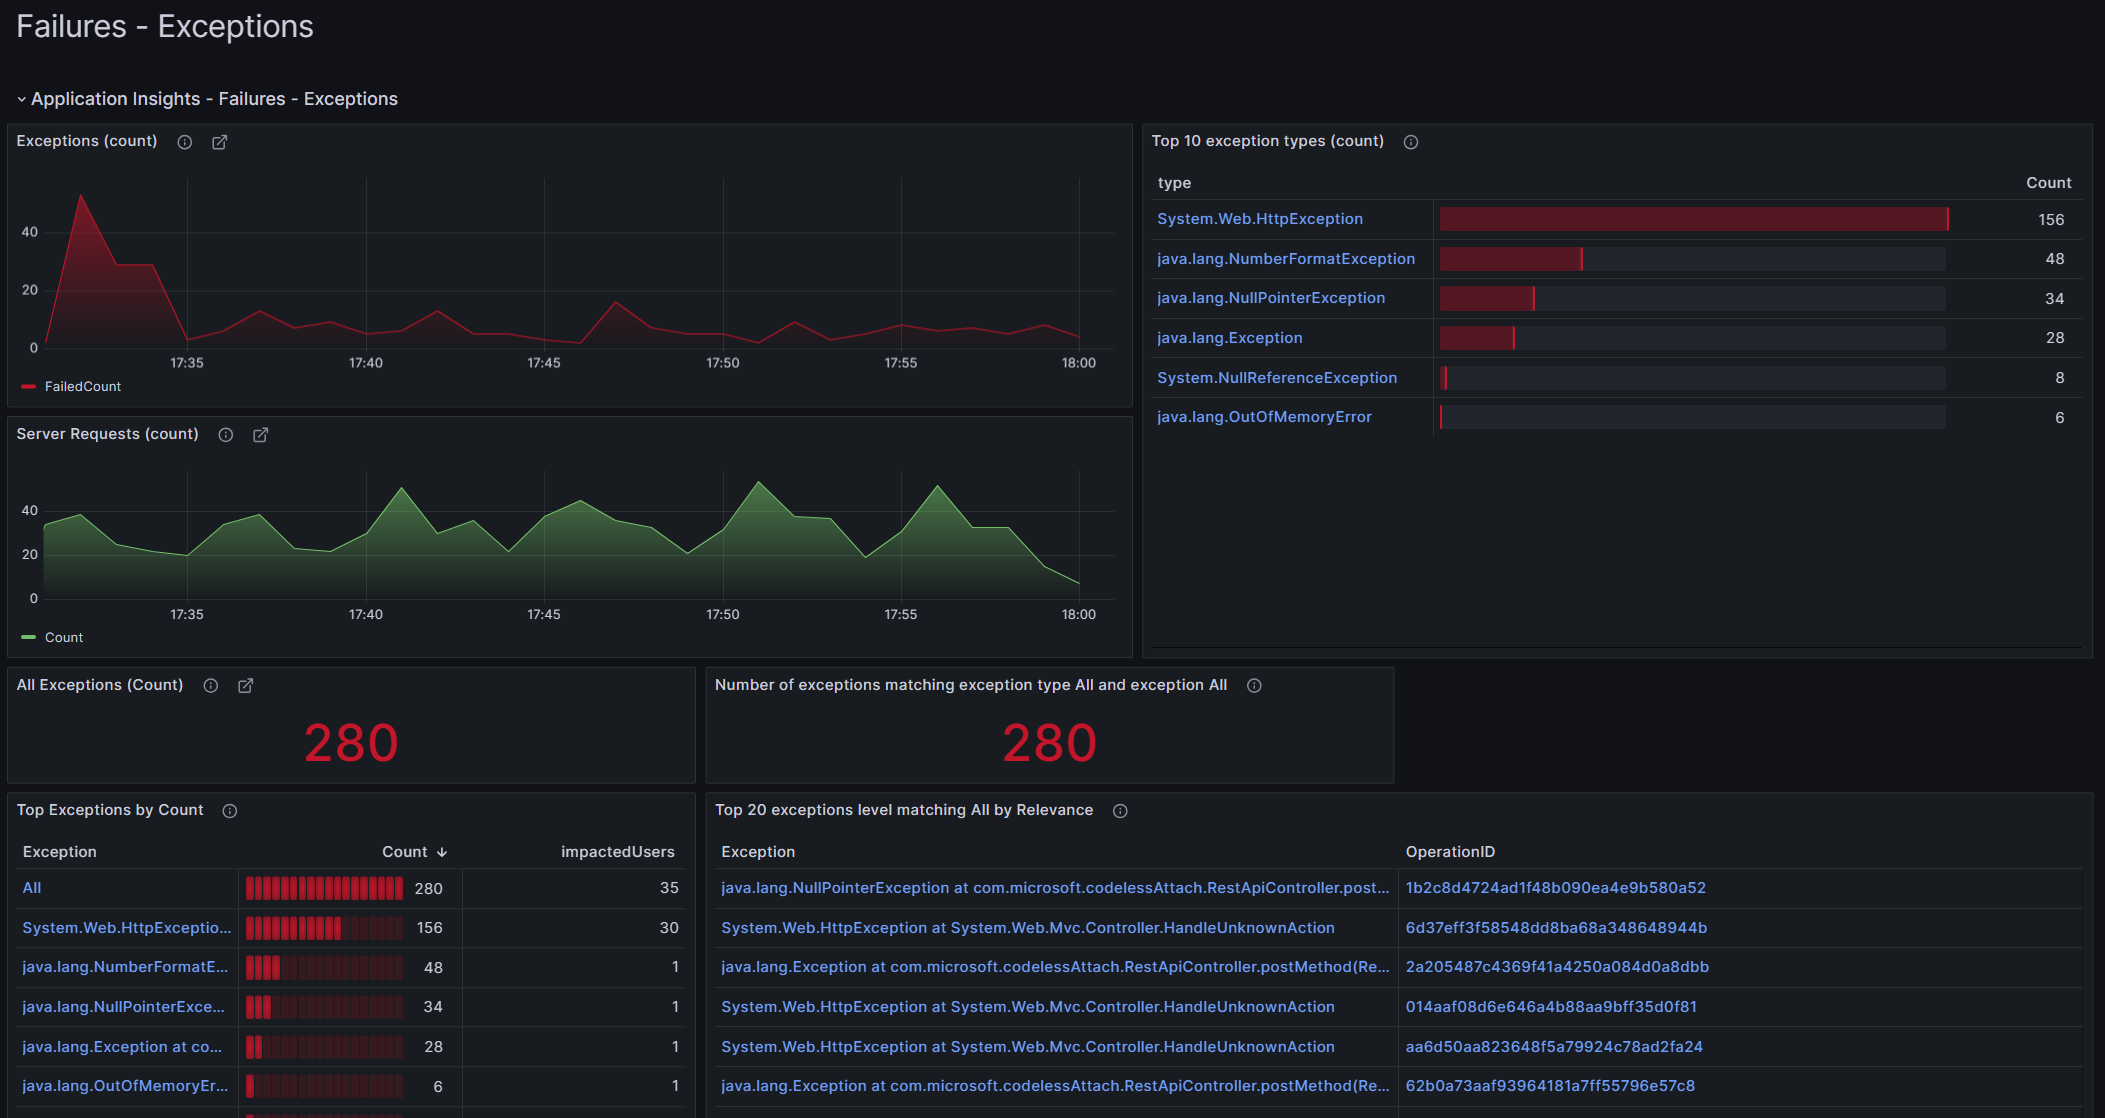
The dashboard provides insights of exceptions through Application Insights.
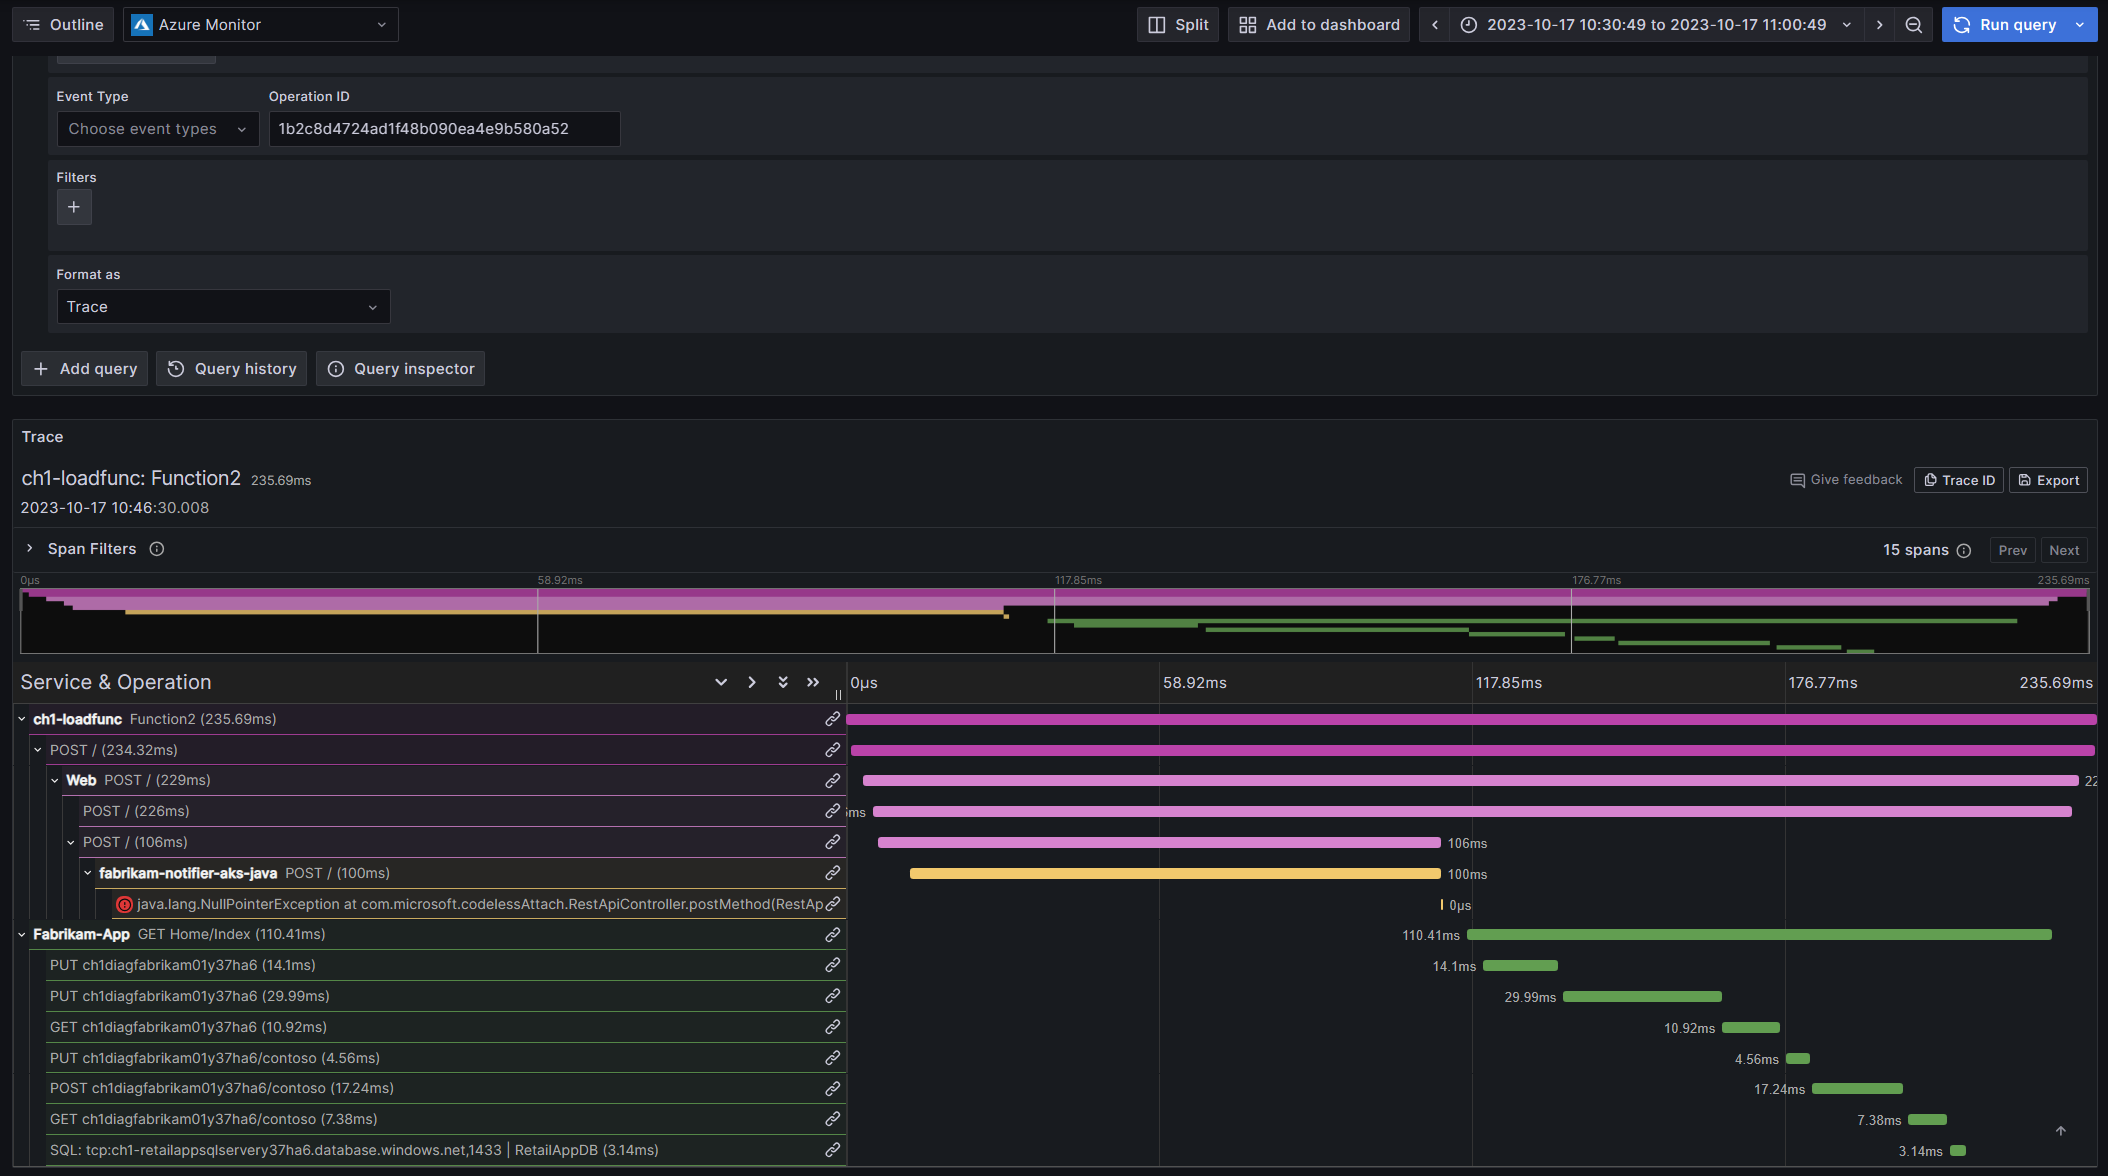
Using Azure Monitor data source, this dashboard provides insights for exceptions of your Azure Applications with trace viewing capabilities that will allow you to better troubleshoot your application’s usage, reliability, responsiveness and browser usage.
More information:
Send your feedback to azmongrafana@microsoft.com
Data source config
Collector config:
Upload an updated version of an exported dashboard.json file from Grafana
| Revision | Description | Created | |
|---|---|---|---|
| Download |
Azure Cosmos DB
With the Grafana plugin for Azure Cosmos DB, you can quickly visualize and query your Azure Cosmos DB data from within Grafana.
Learn more
