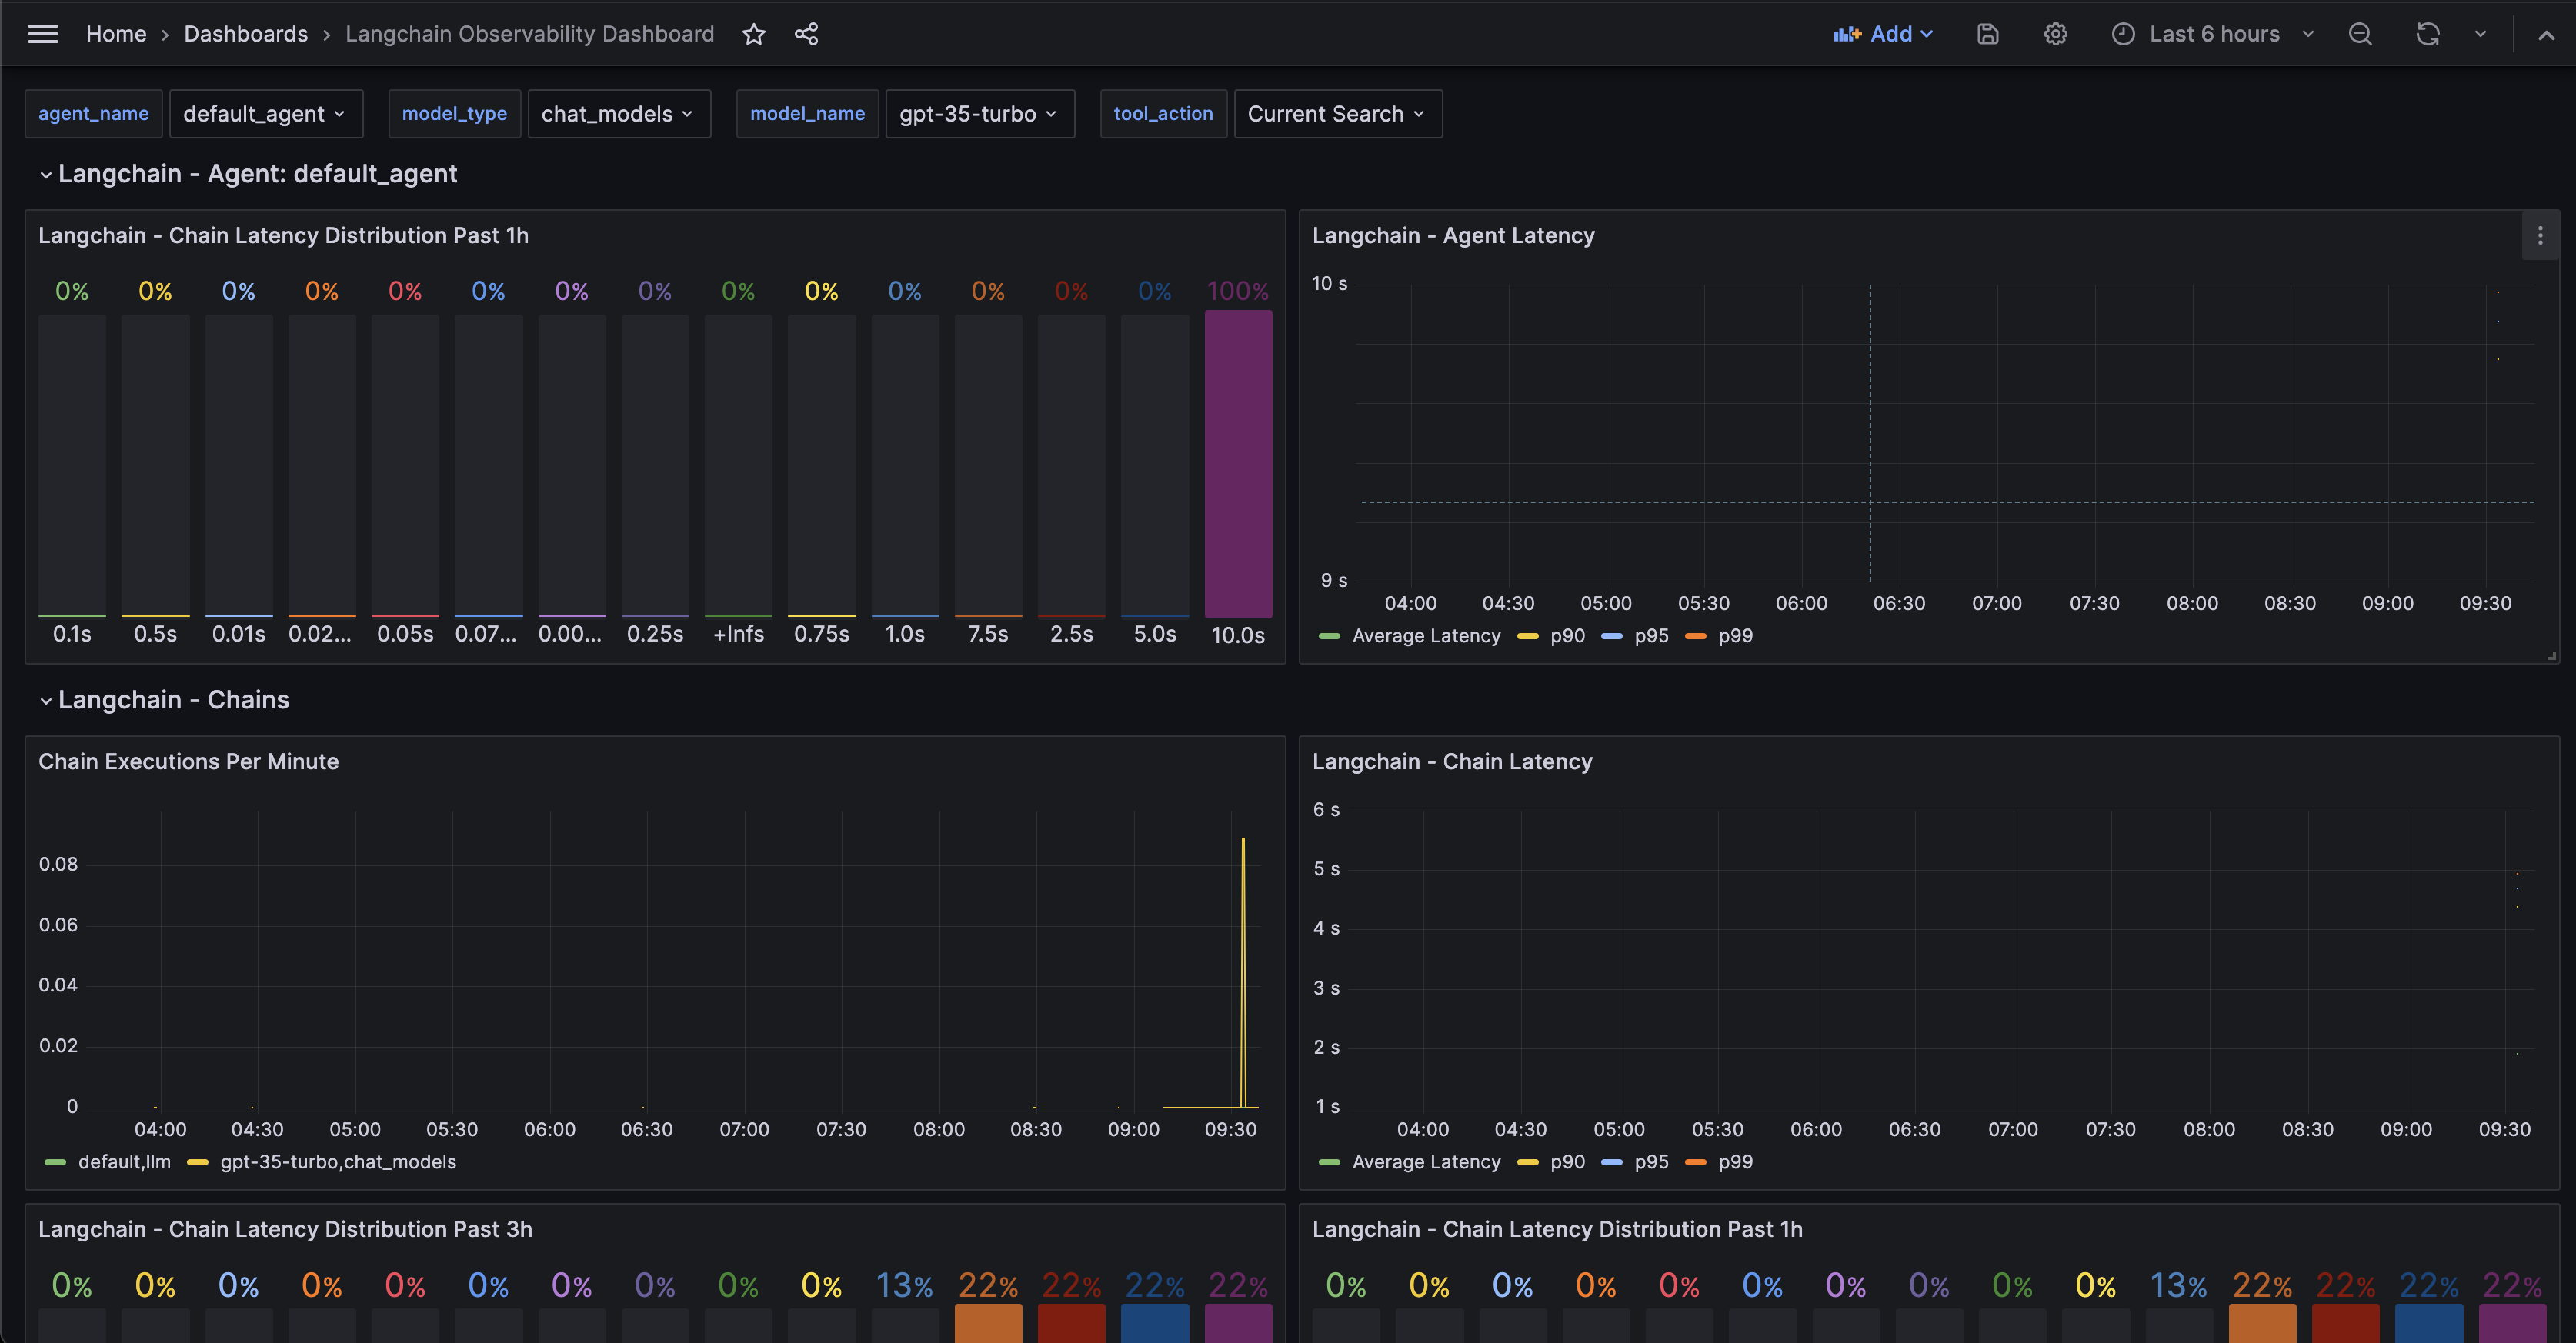
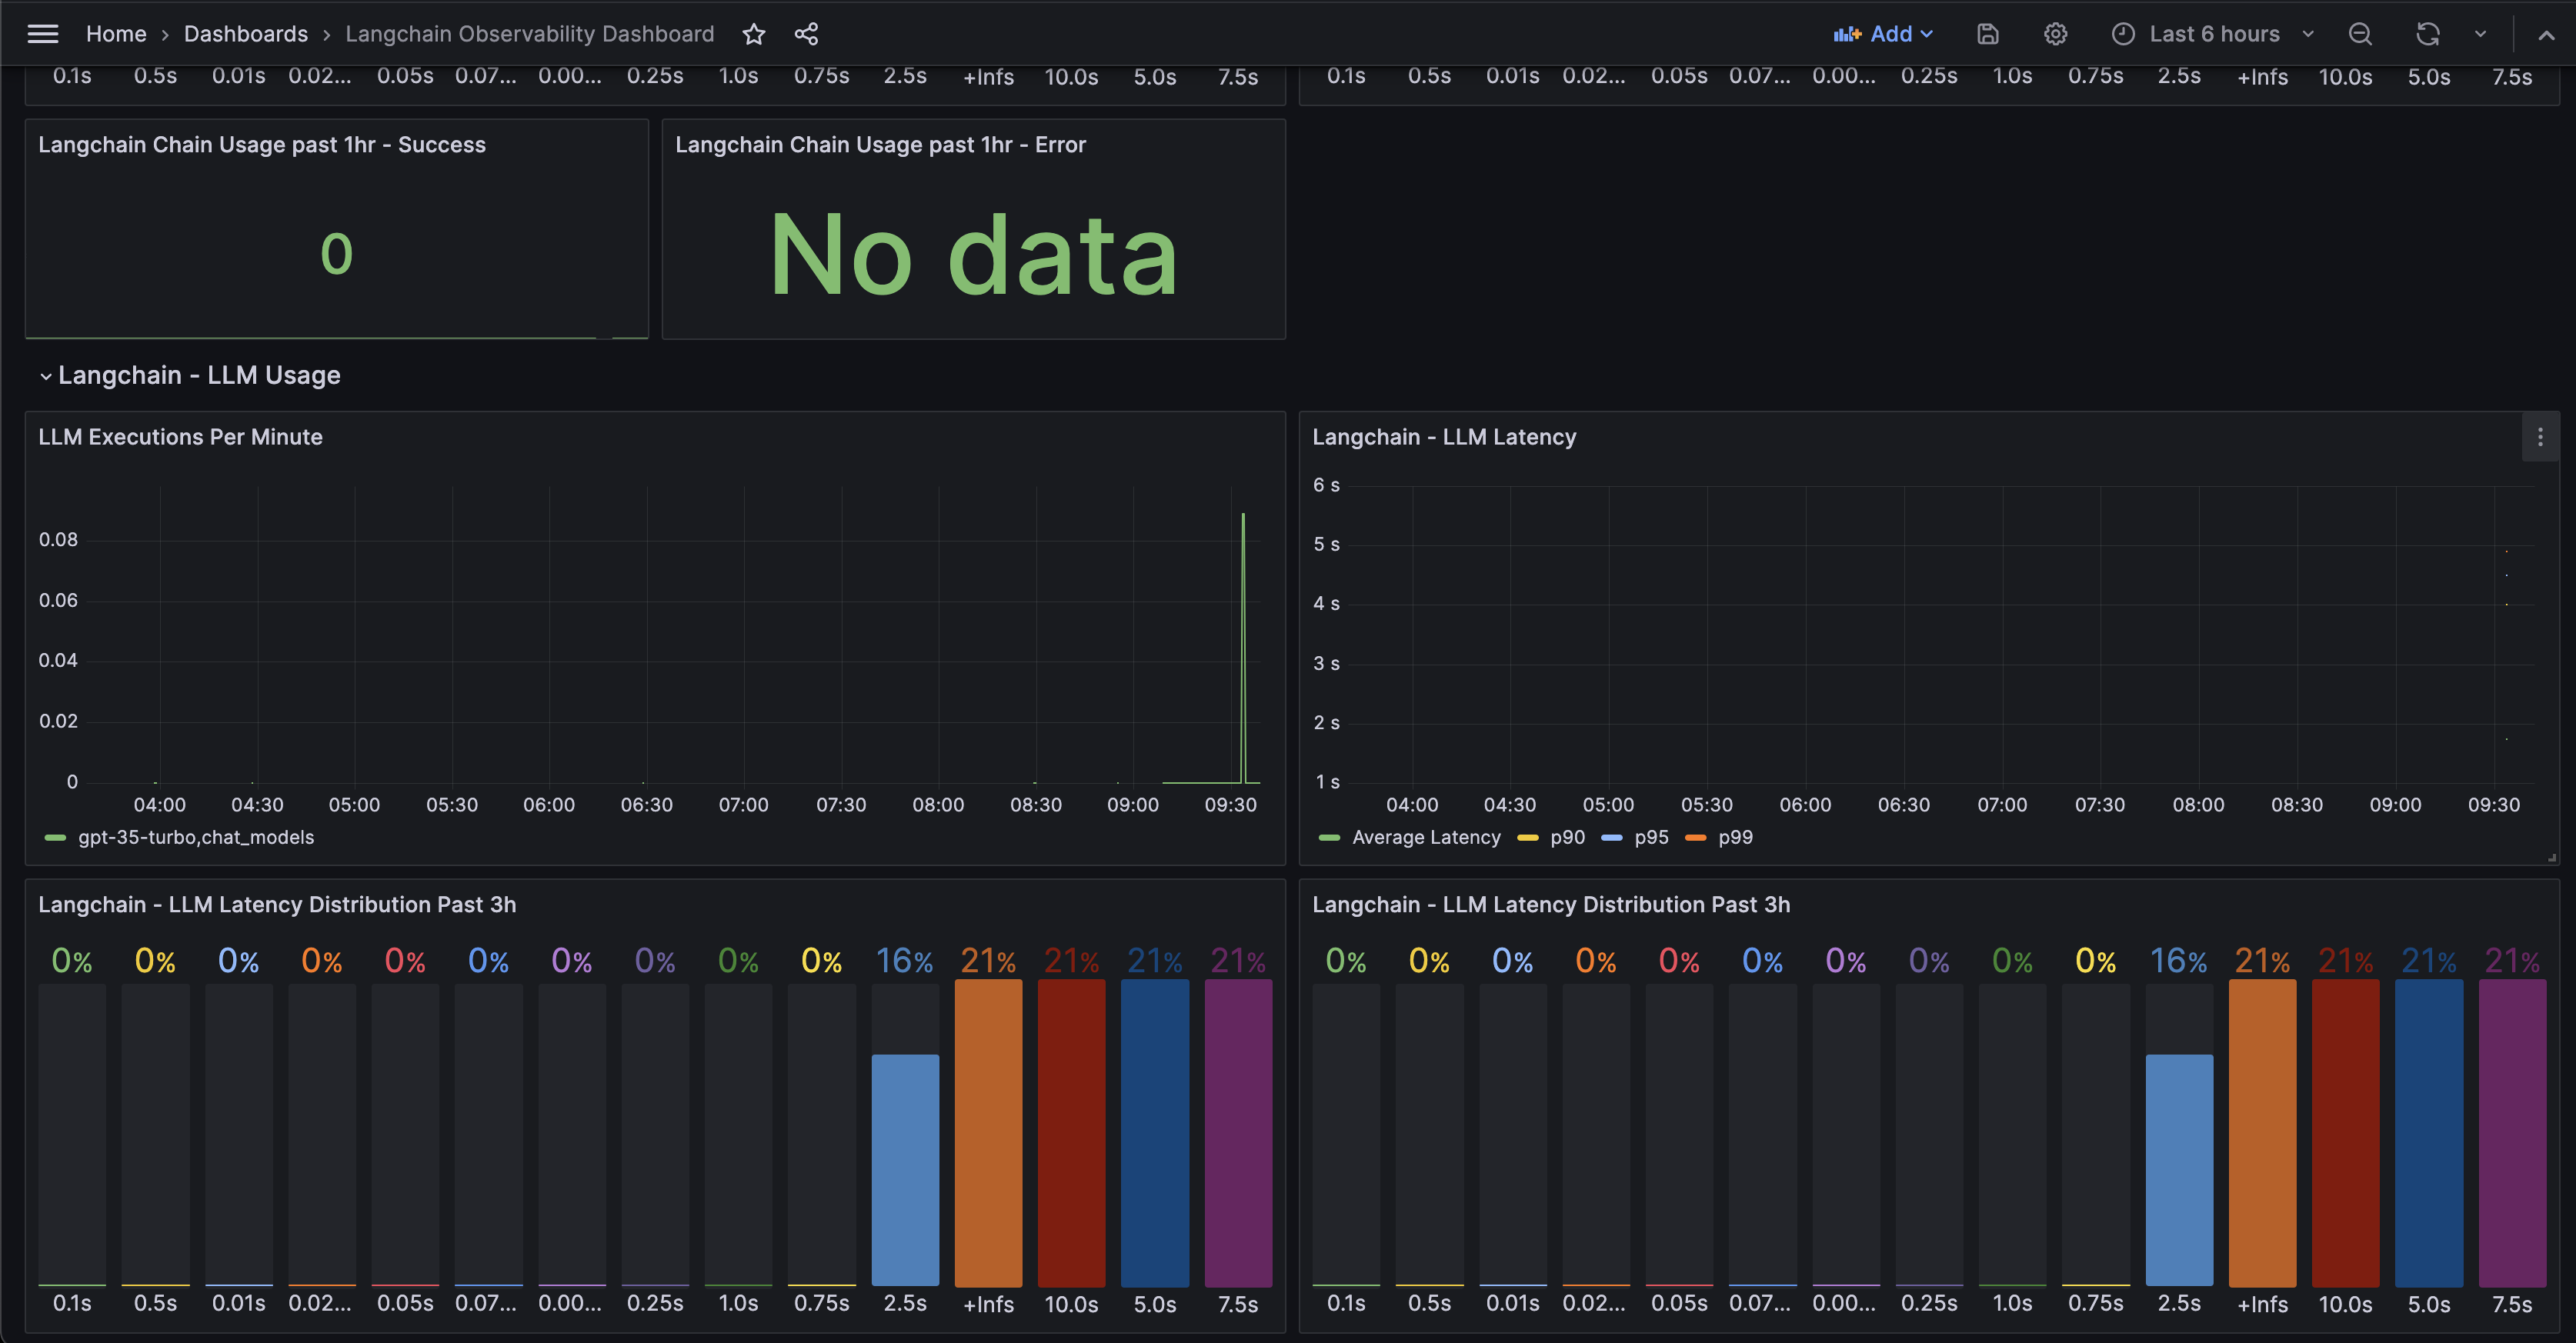
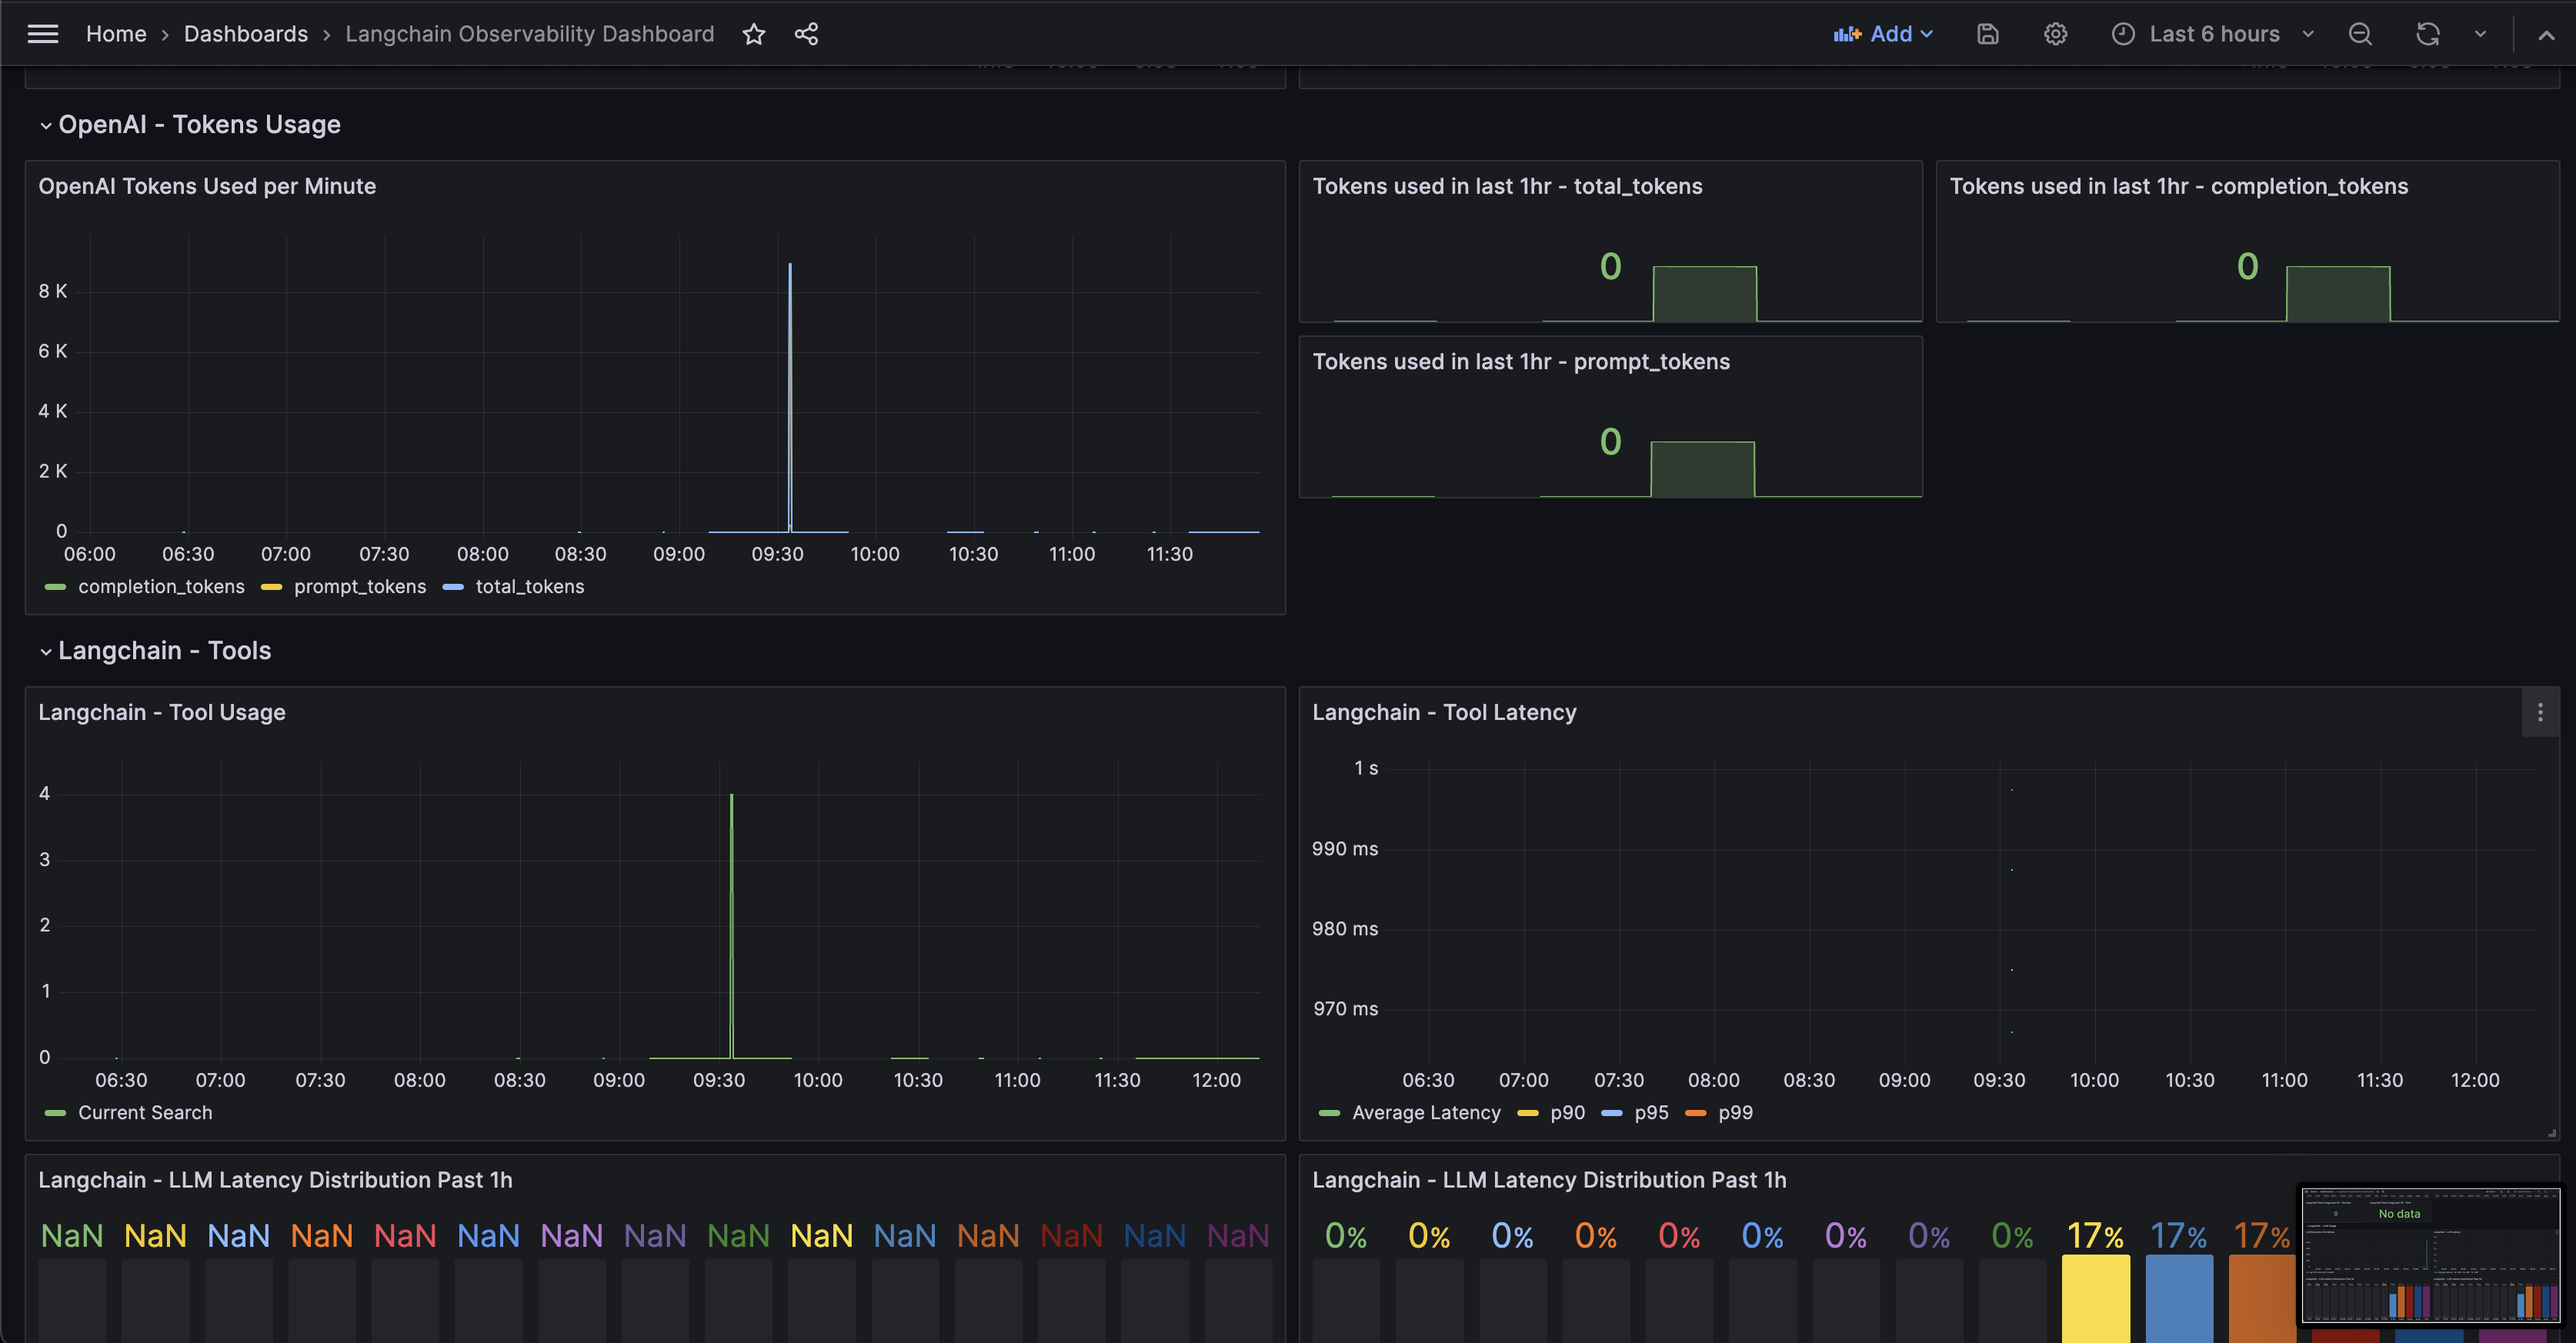
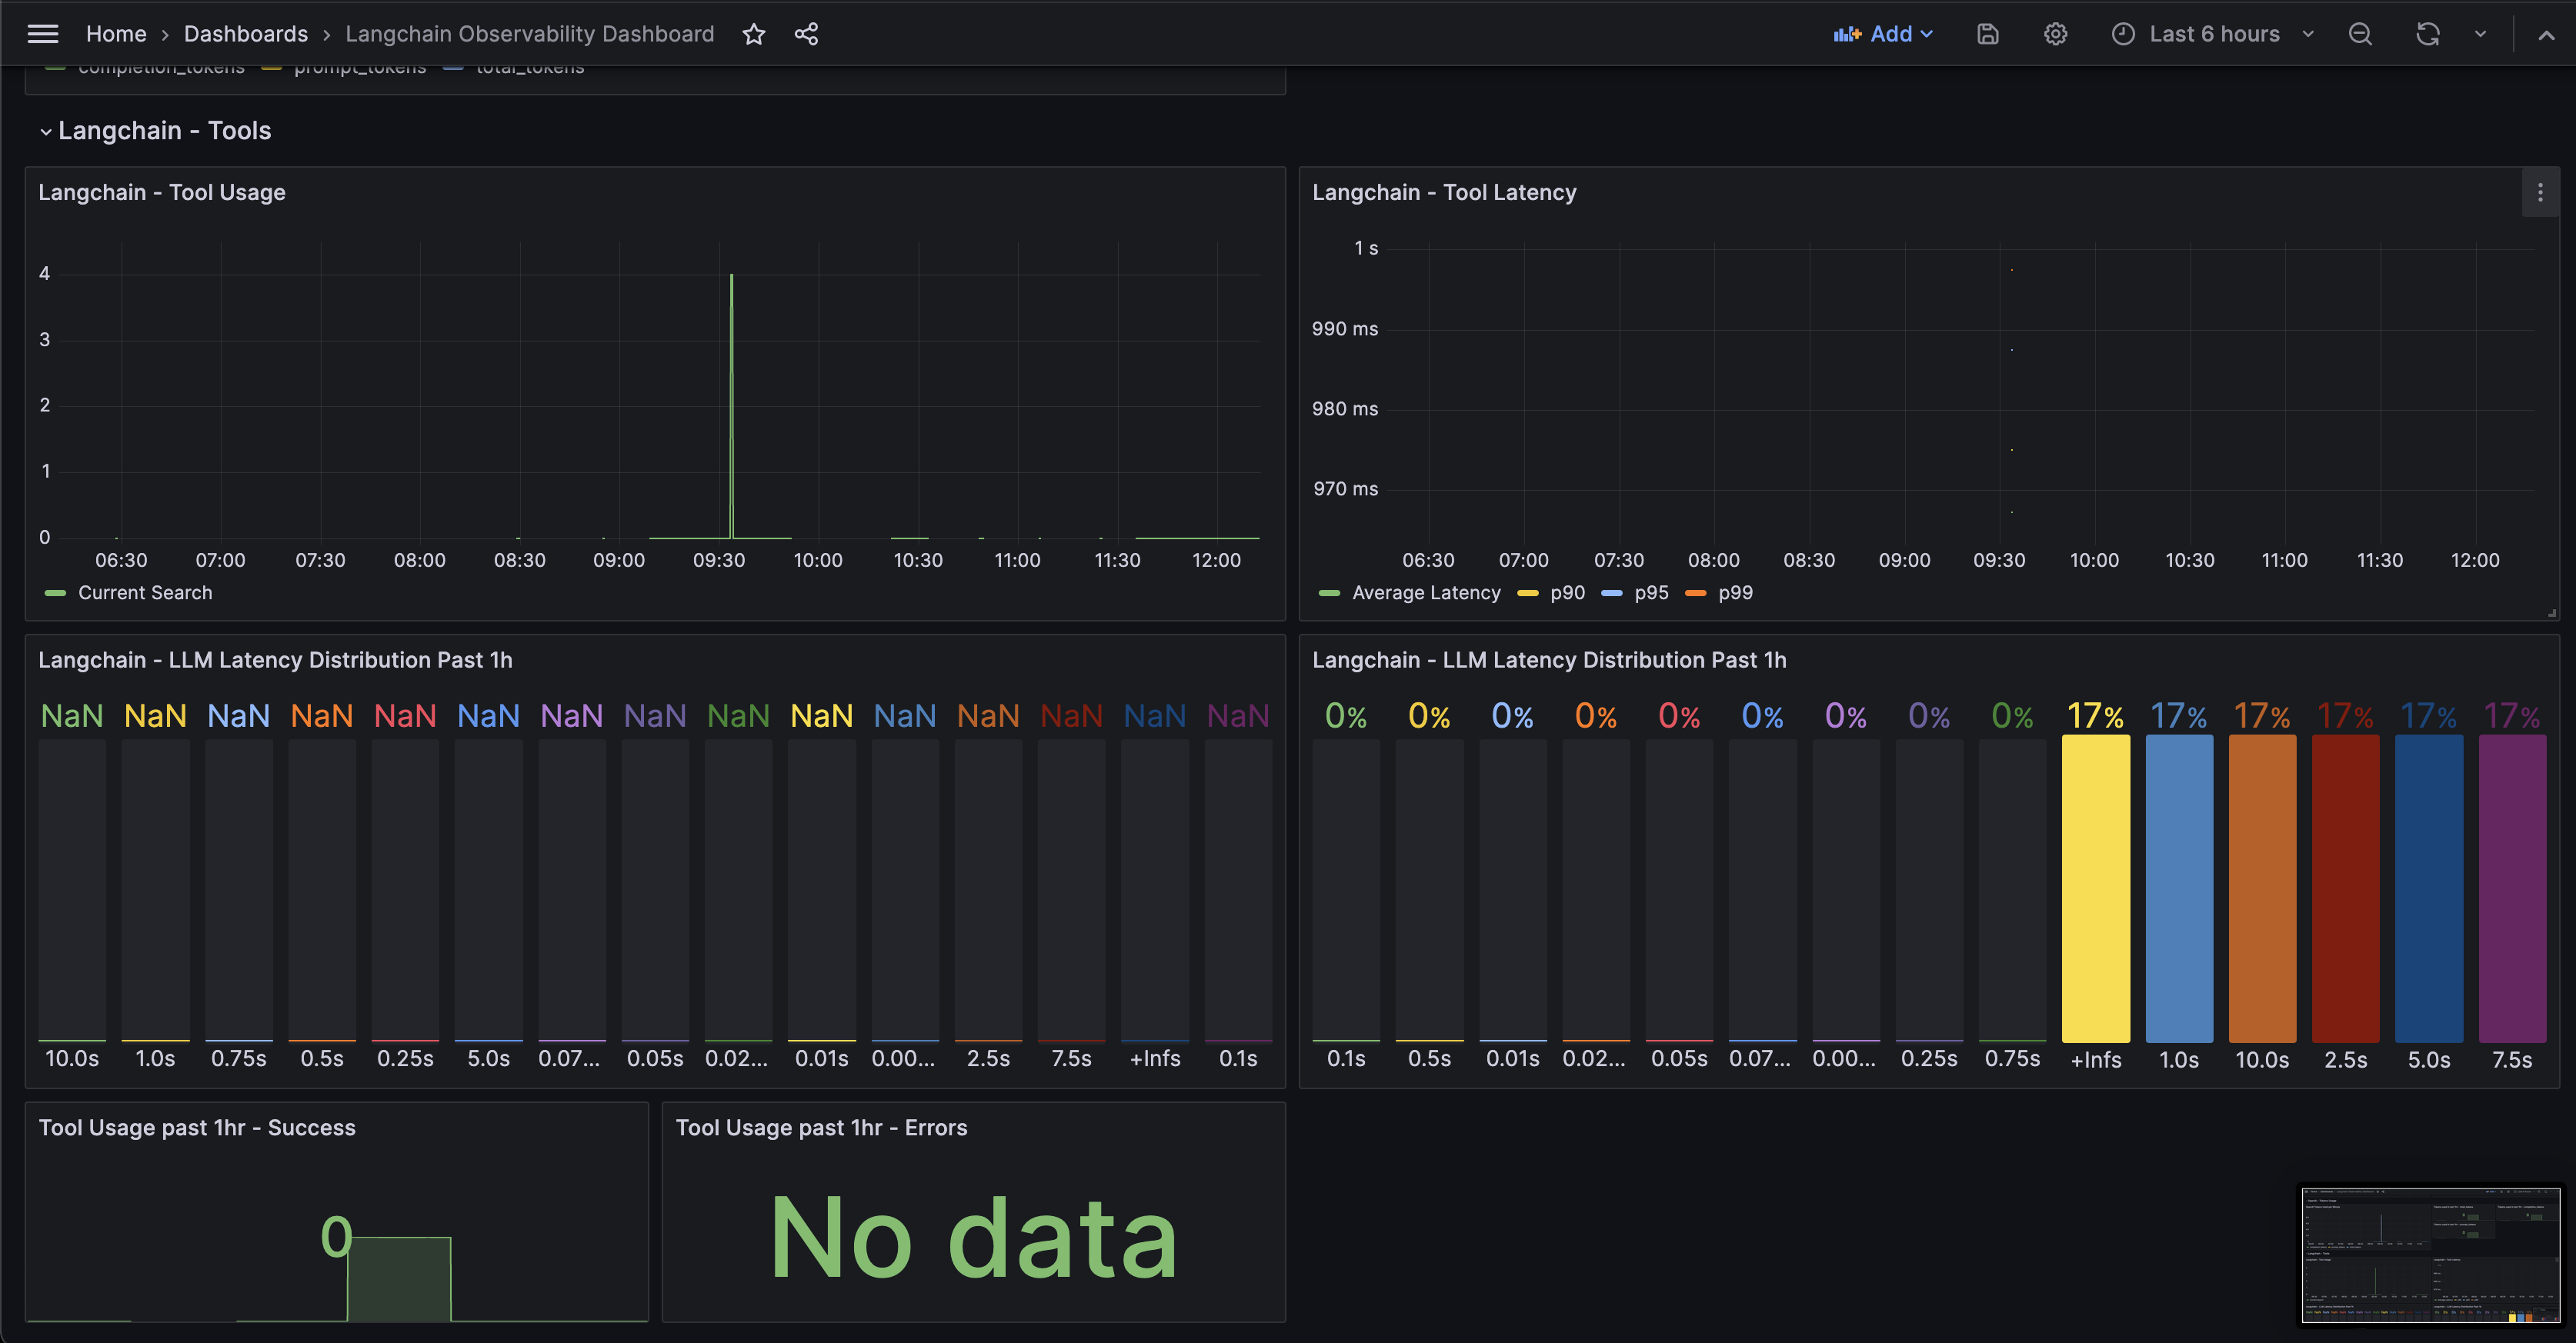
Langchain Observability Dashboard
Observability dashboard for langchain framework. This dashboard is powered by https://xpuls.ai. For auto-instrumentation checkout: https://github.com/xpuls-labs/xpuls-ml-sdk.
Auto Instrument your langchain application with a single line of code. Steps:
- Install xpuls-ml-sdk from pypi using
pip install xpuls-ml-sdk - Add below code (basic usage, for advanced guide refer to below links)
from xpuls.mlmonitor.langchain.instrument import LangchainTelemetry
Add default labels that will be added to all captured metrics
default_labels = {"service": "ml-project-service", "k8s-cluster": "app0", "name": "fallback_value"}
Enable the auto-telemetry
LangchainTelemetry(default_labels=default_labels).auto_instrument()
Checkout more details at the github repository: xpuls-ml-sdk
For detailed documentation on how to instrument, check out: https://github.com/xpuls-labs/xpuls-ml-sdk-python/blob/main/docs/langchain.md
To know more, visit: https://xpuls.ai
Give us a star ⭐️ and follow us on github at xpuls-labs, if you find this helpful
For advanced tracking and logs integration, you can try out our platform @ https://platform.xpuls.ai. It's FREE
Data source config
Collector config:
Upload an updated version of an exported dashboard.json file from Grafana
| Revision | Description | Created | |
|---|---|---|---|
| Download |


