worldPing: Alerting Example
Configuring Grafana Alerts with worldPing as a data source.

Get the latest version of worldPing
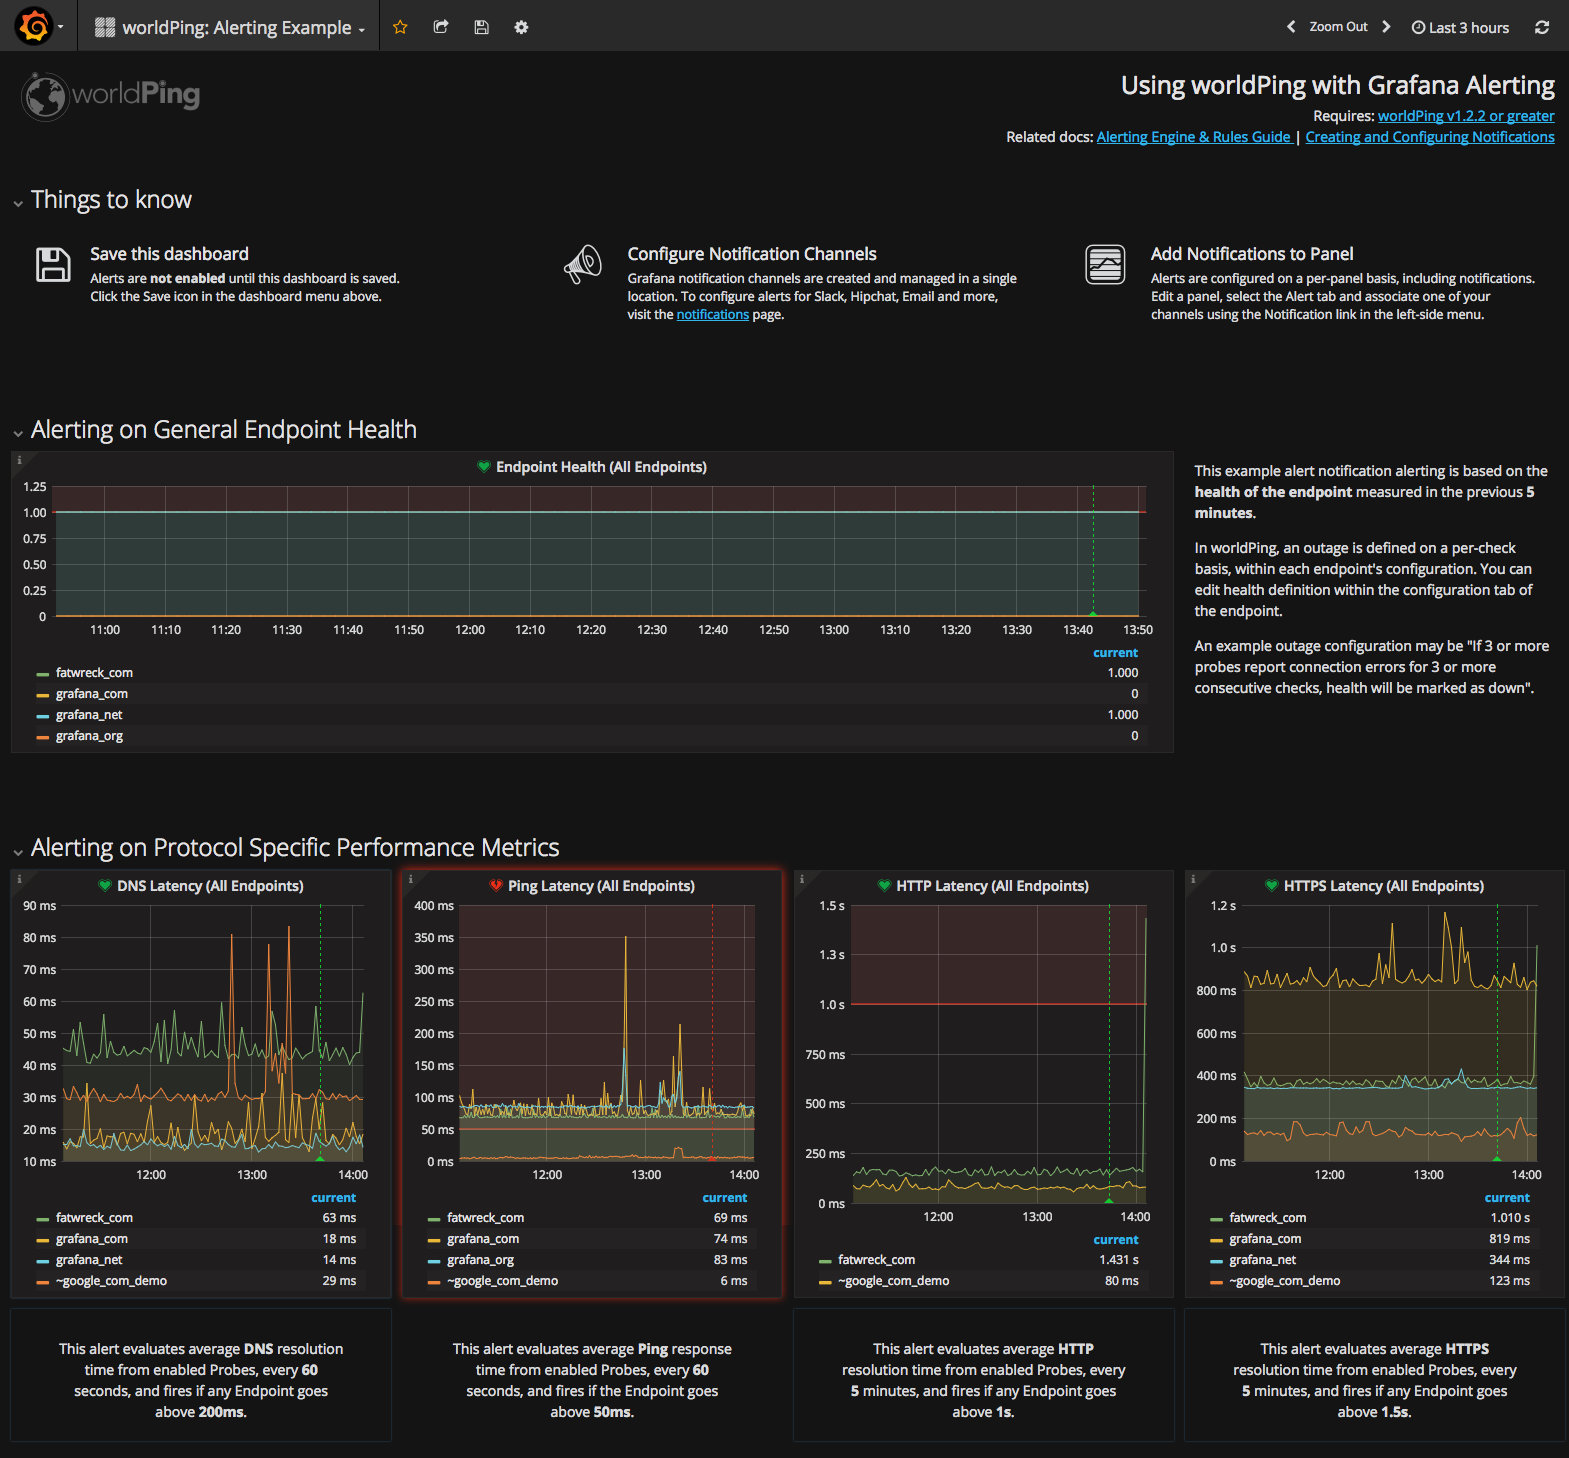
This worldPing Example Dashboard ships with 5 alert-enabled panels to bring metrics-based alerting into your global performance monitoring.
Included Panels:
Alerting on General Endpoint Health (1 panel)
This example alert notification alerting is based on the health of the endpoint measured in the previous 5 minutes.
In worldPing, an outage is defined on a per-check basis, within each endpoint's configuration. You can edit health definition within the configuration tab of the endpoint. An example outage configuration may be "If 3 or more probes report connection errors for 3 or more consecutive checks, health will be marked as down".
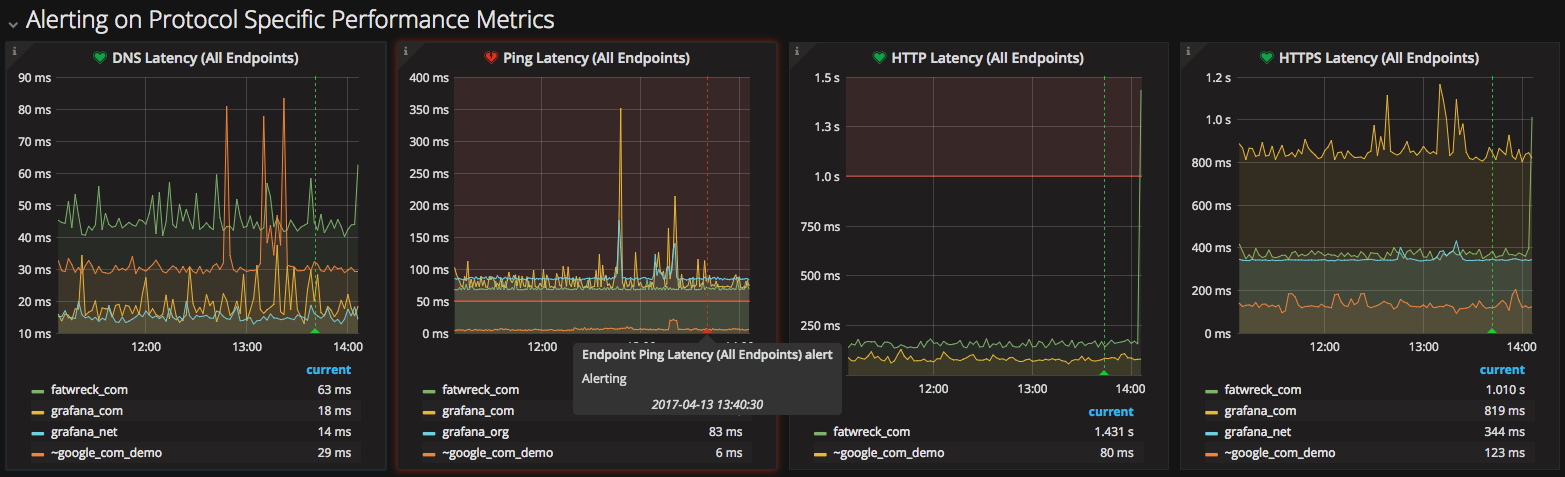
Alerting on Protocol Specific Performance Metrics (4 panels)
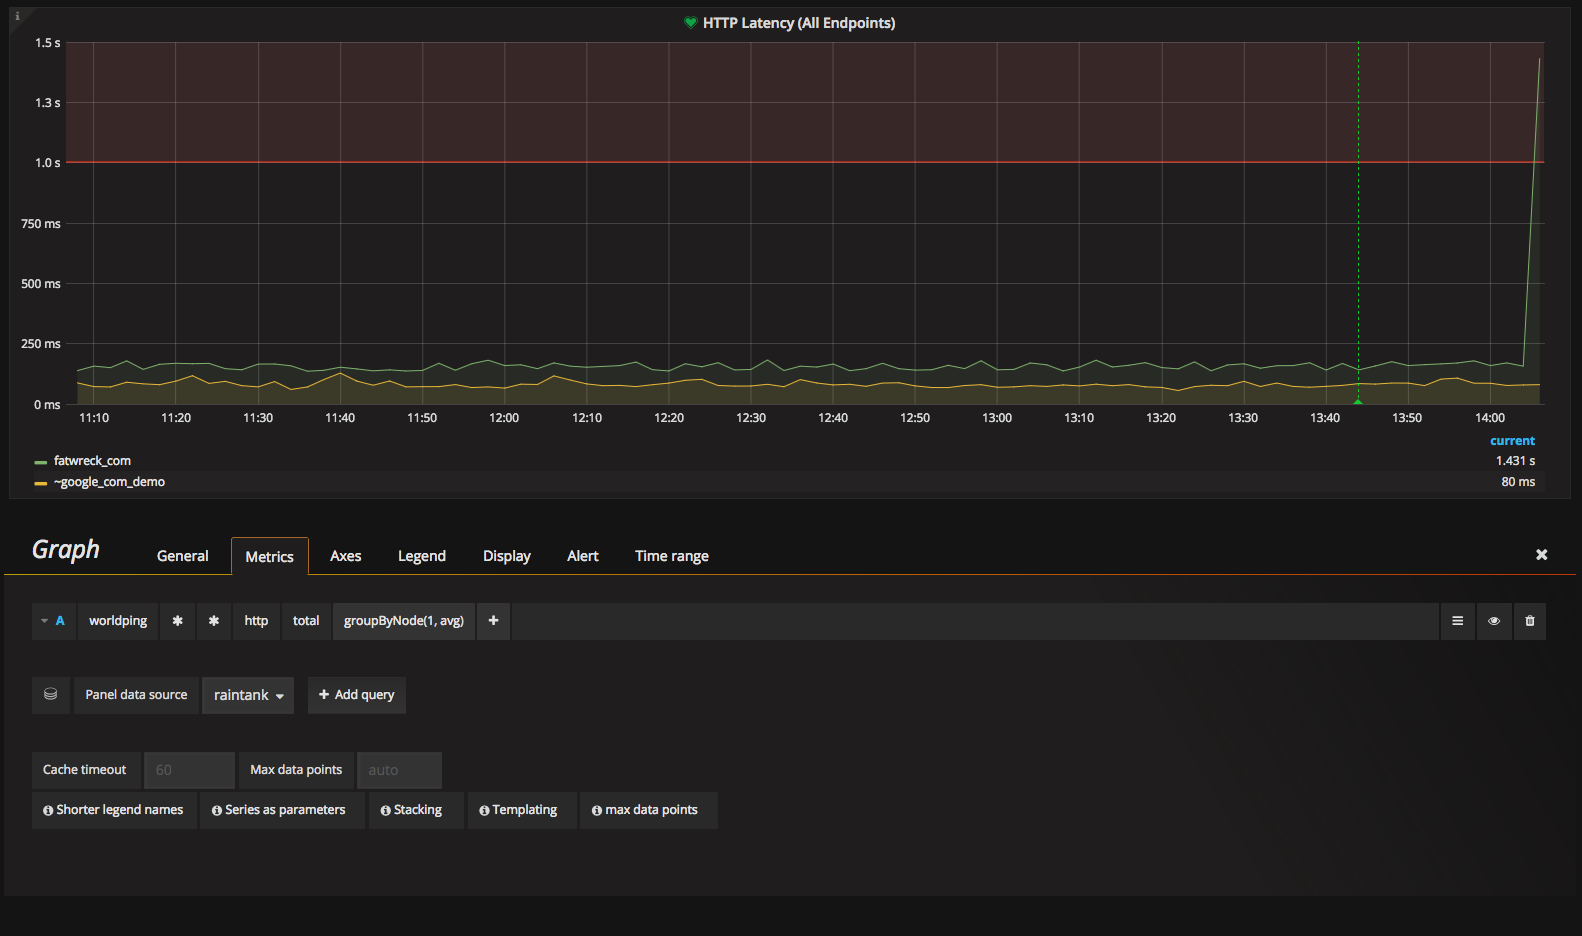
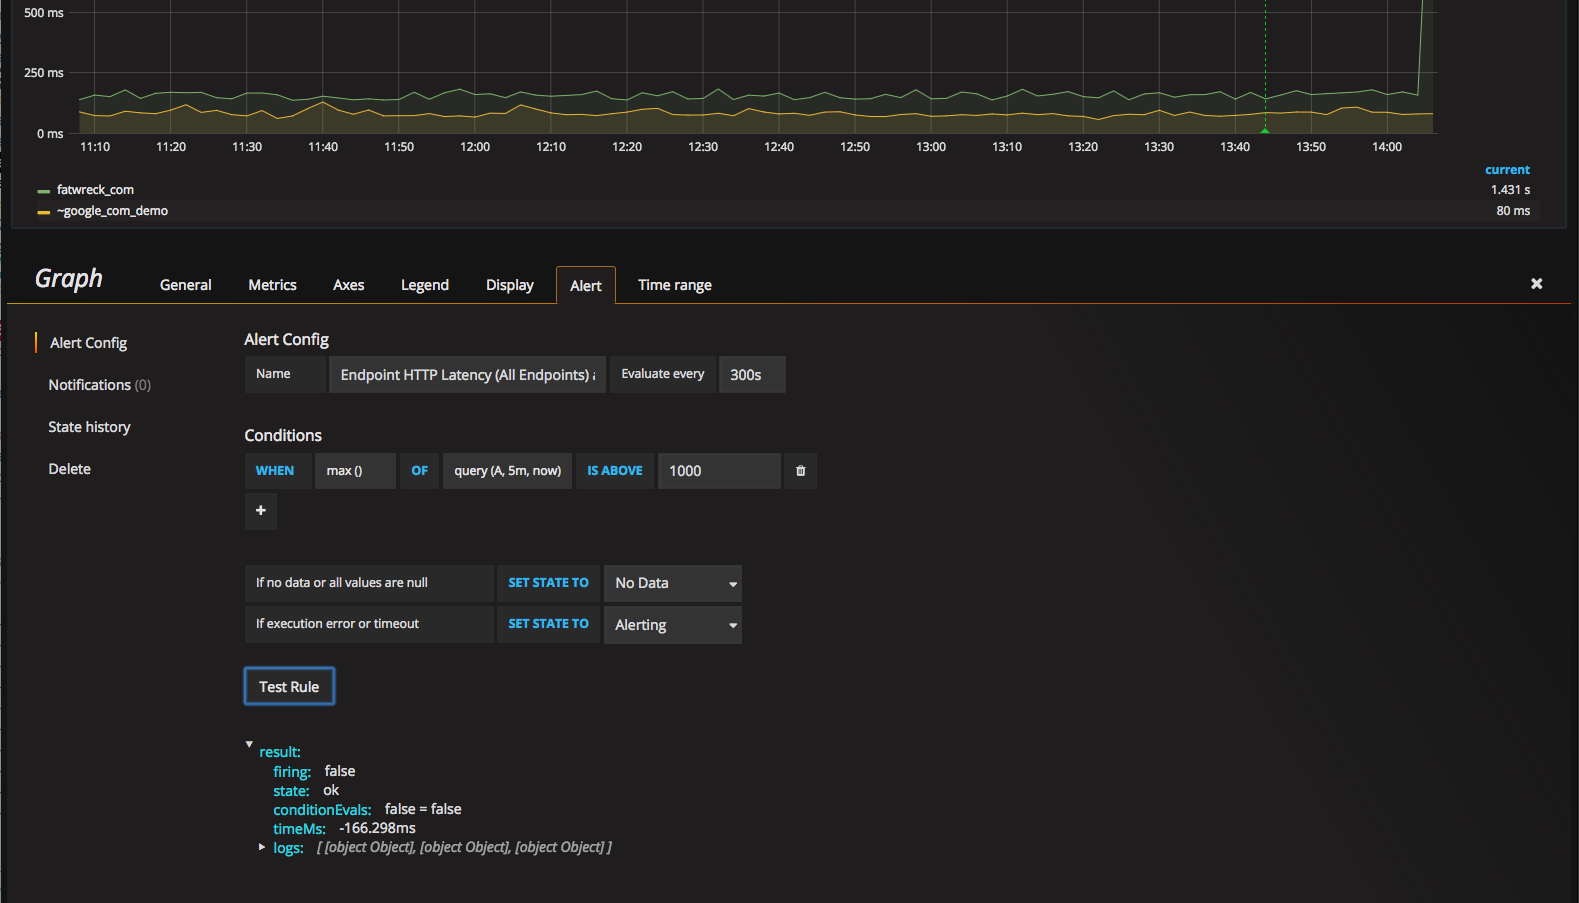
The more advanced checks can evaluate metrics specific to the protocol to satisfy your set conditions. Pre-configured panels are provided for DNS, Ping, HTTP and HTTPS.
For example, the DNS alert evaluates average resolution time from enabled Probes, every 60 seconds, and fires if any Endpoint goes above 200ms.
All conditions may be easily modified using the Grafana Alert interface.
Data source config
Collector config:
Upload an updated version of an exported dashboard.json file from Grafana
| Revision | Description | Created | |
|---|---|---|---|
| Download |