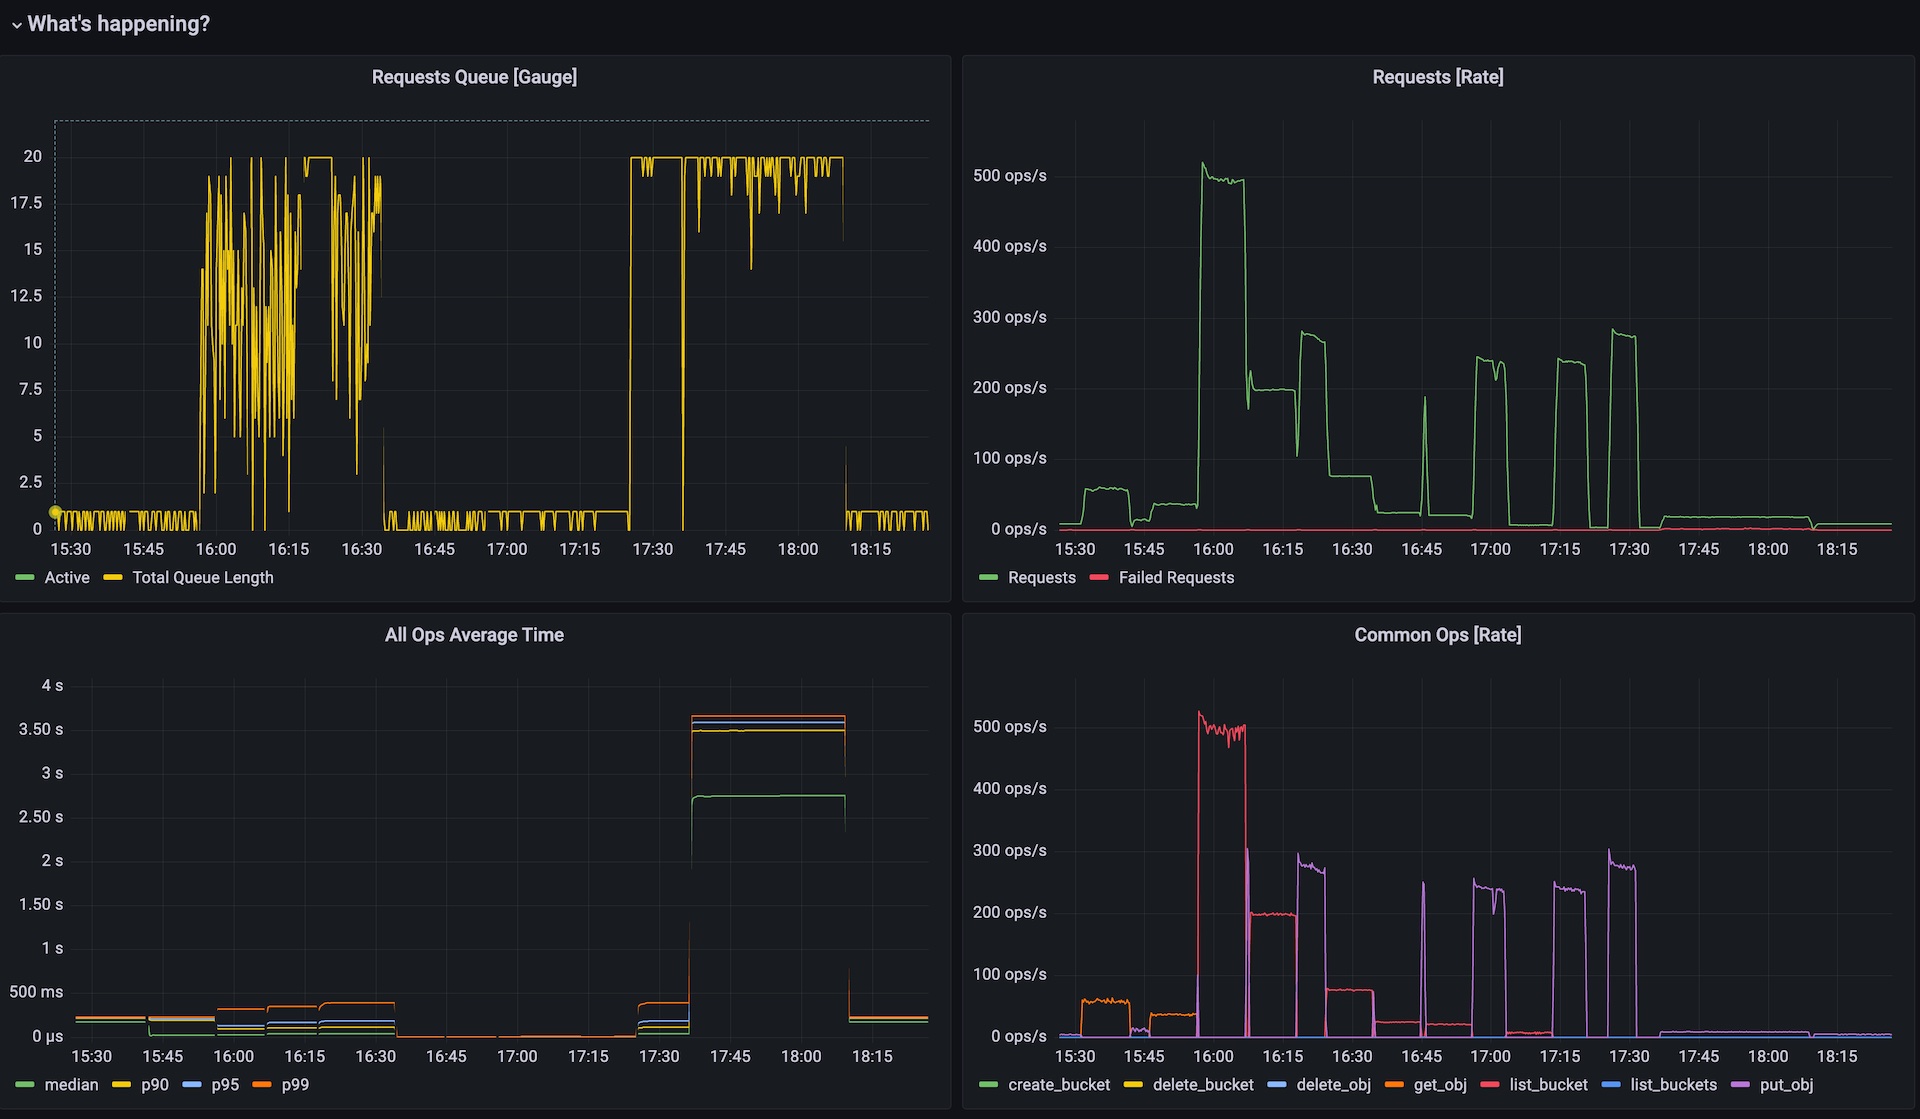
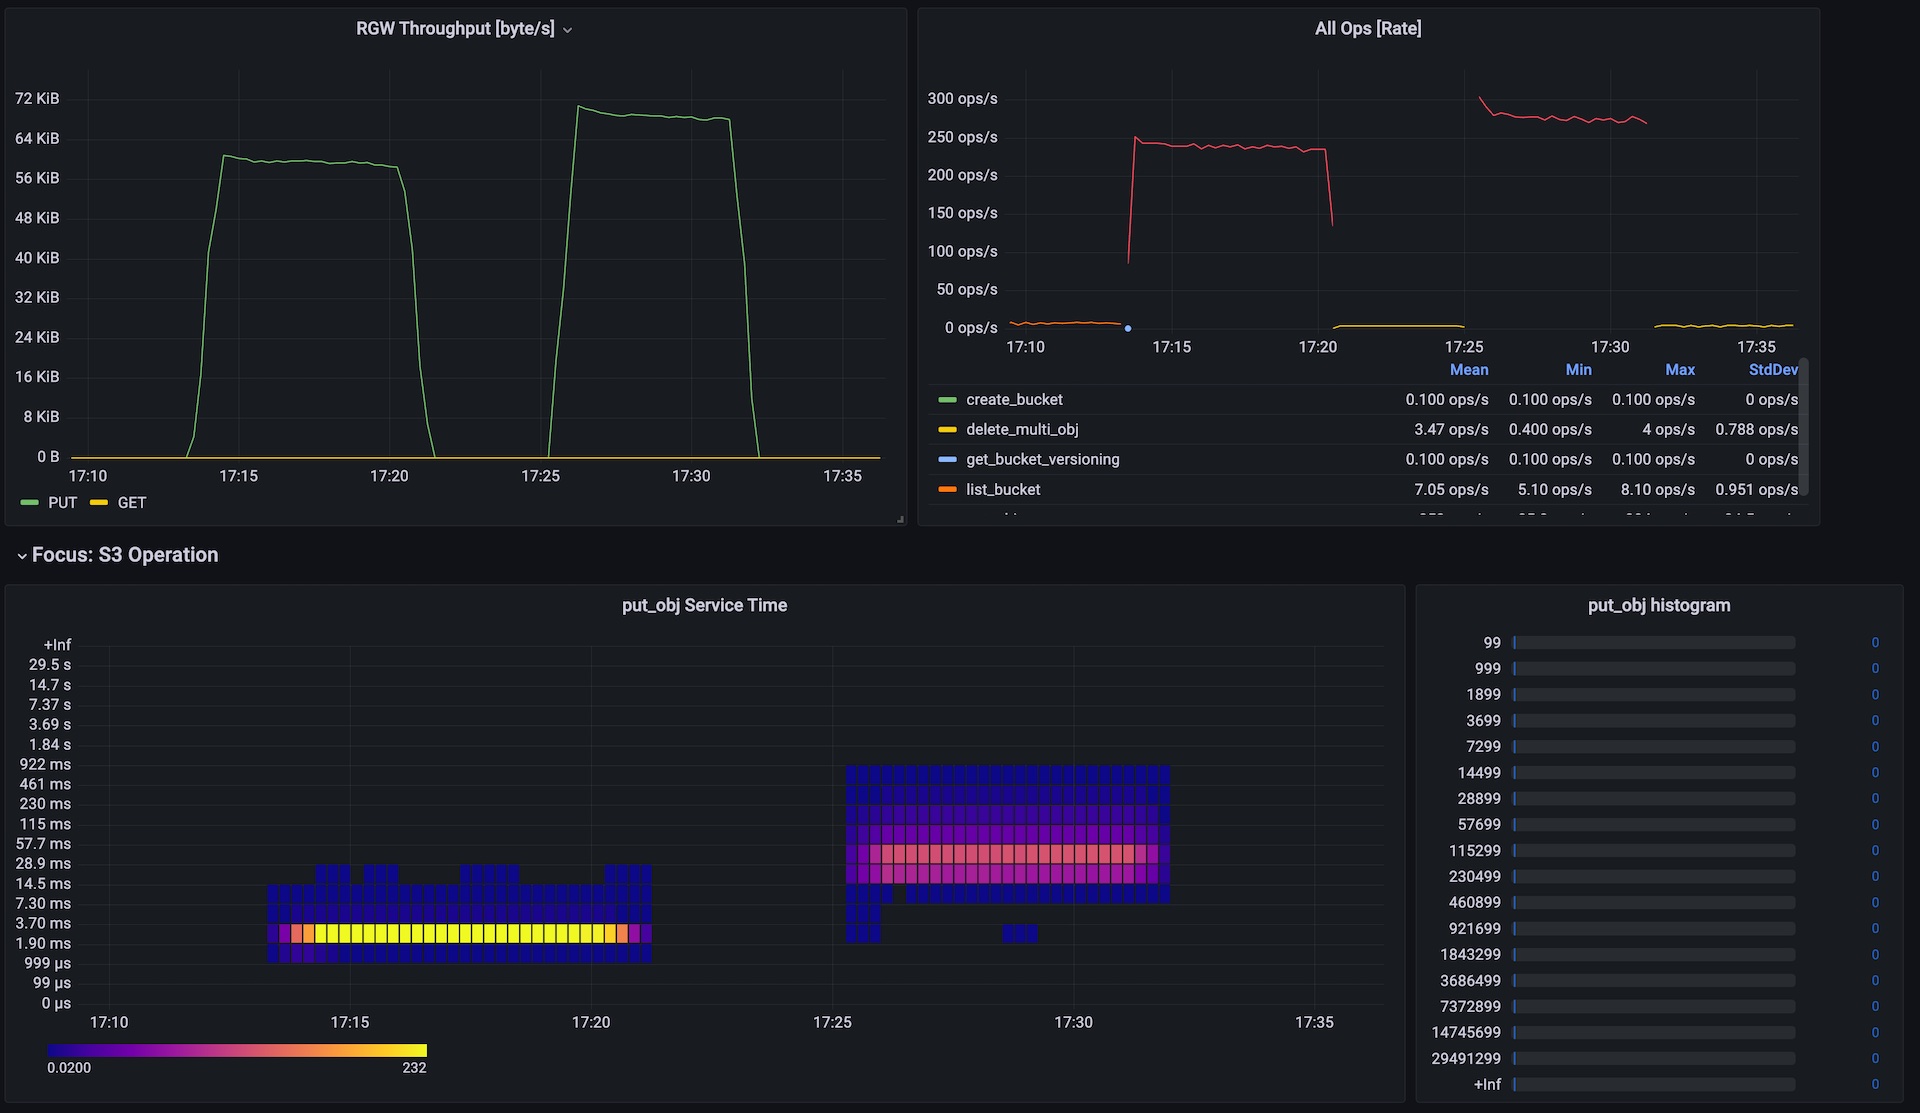
S3GW
https://s3gw.io/
Activate S3GW status frontend:
--rgw-frontends 'beast port=7480, status bind=127.0.0.1 port=9090'
and let Prometheus scrape it:
scrape_configs:
  - job_name: 's3gw-status'
    metrics_path: '/prometheus'
    static_configs:
      - targets:
        - 127.0.0.1:9090
Data source config
Collector config:
Upload an updated version of an exported dashboard.json file from Grafana
| Revision | Description | Created | |
|---|---|---|---|
| Download |


