
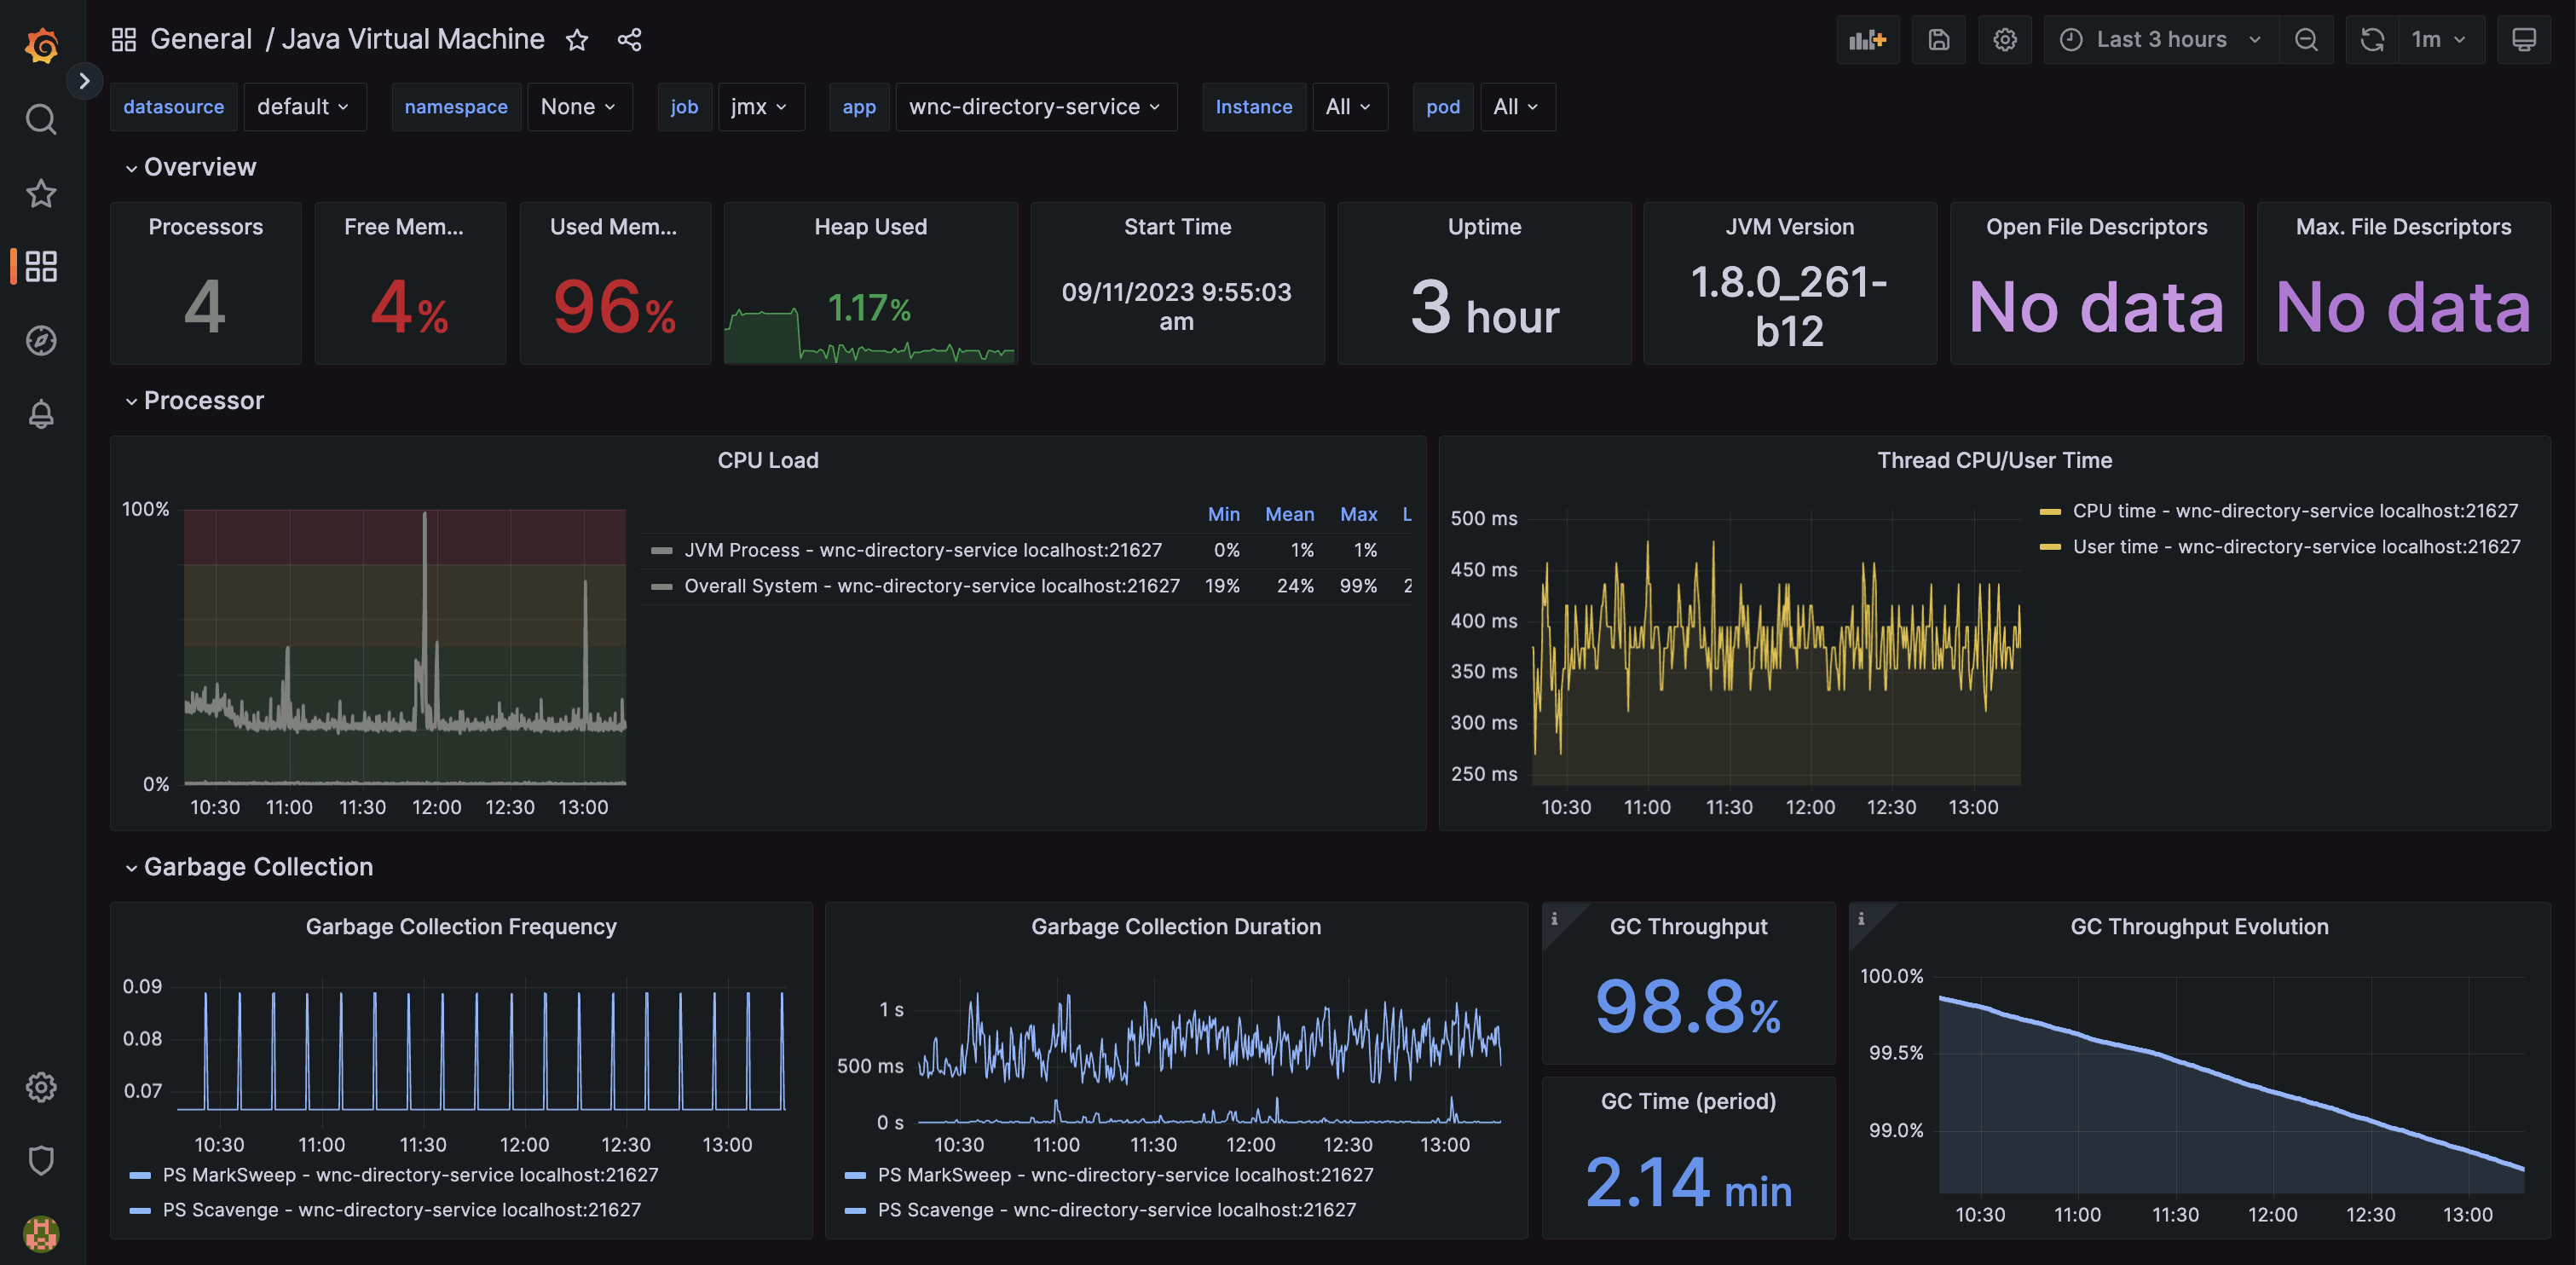
Java Virtual Machine
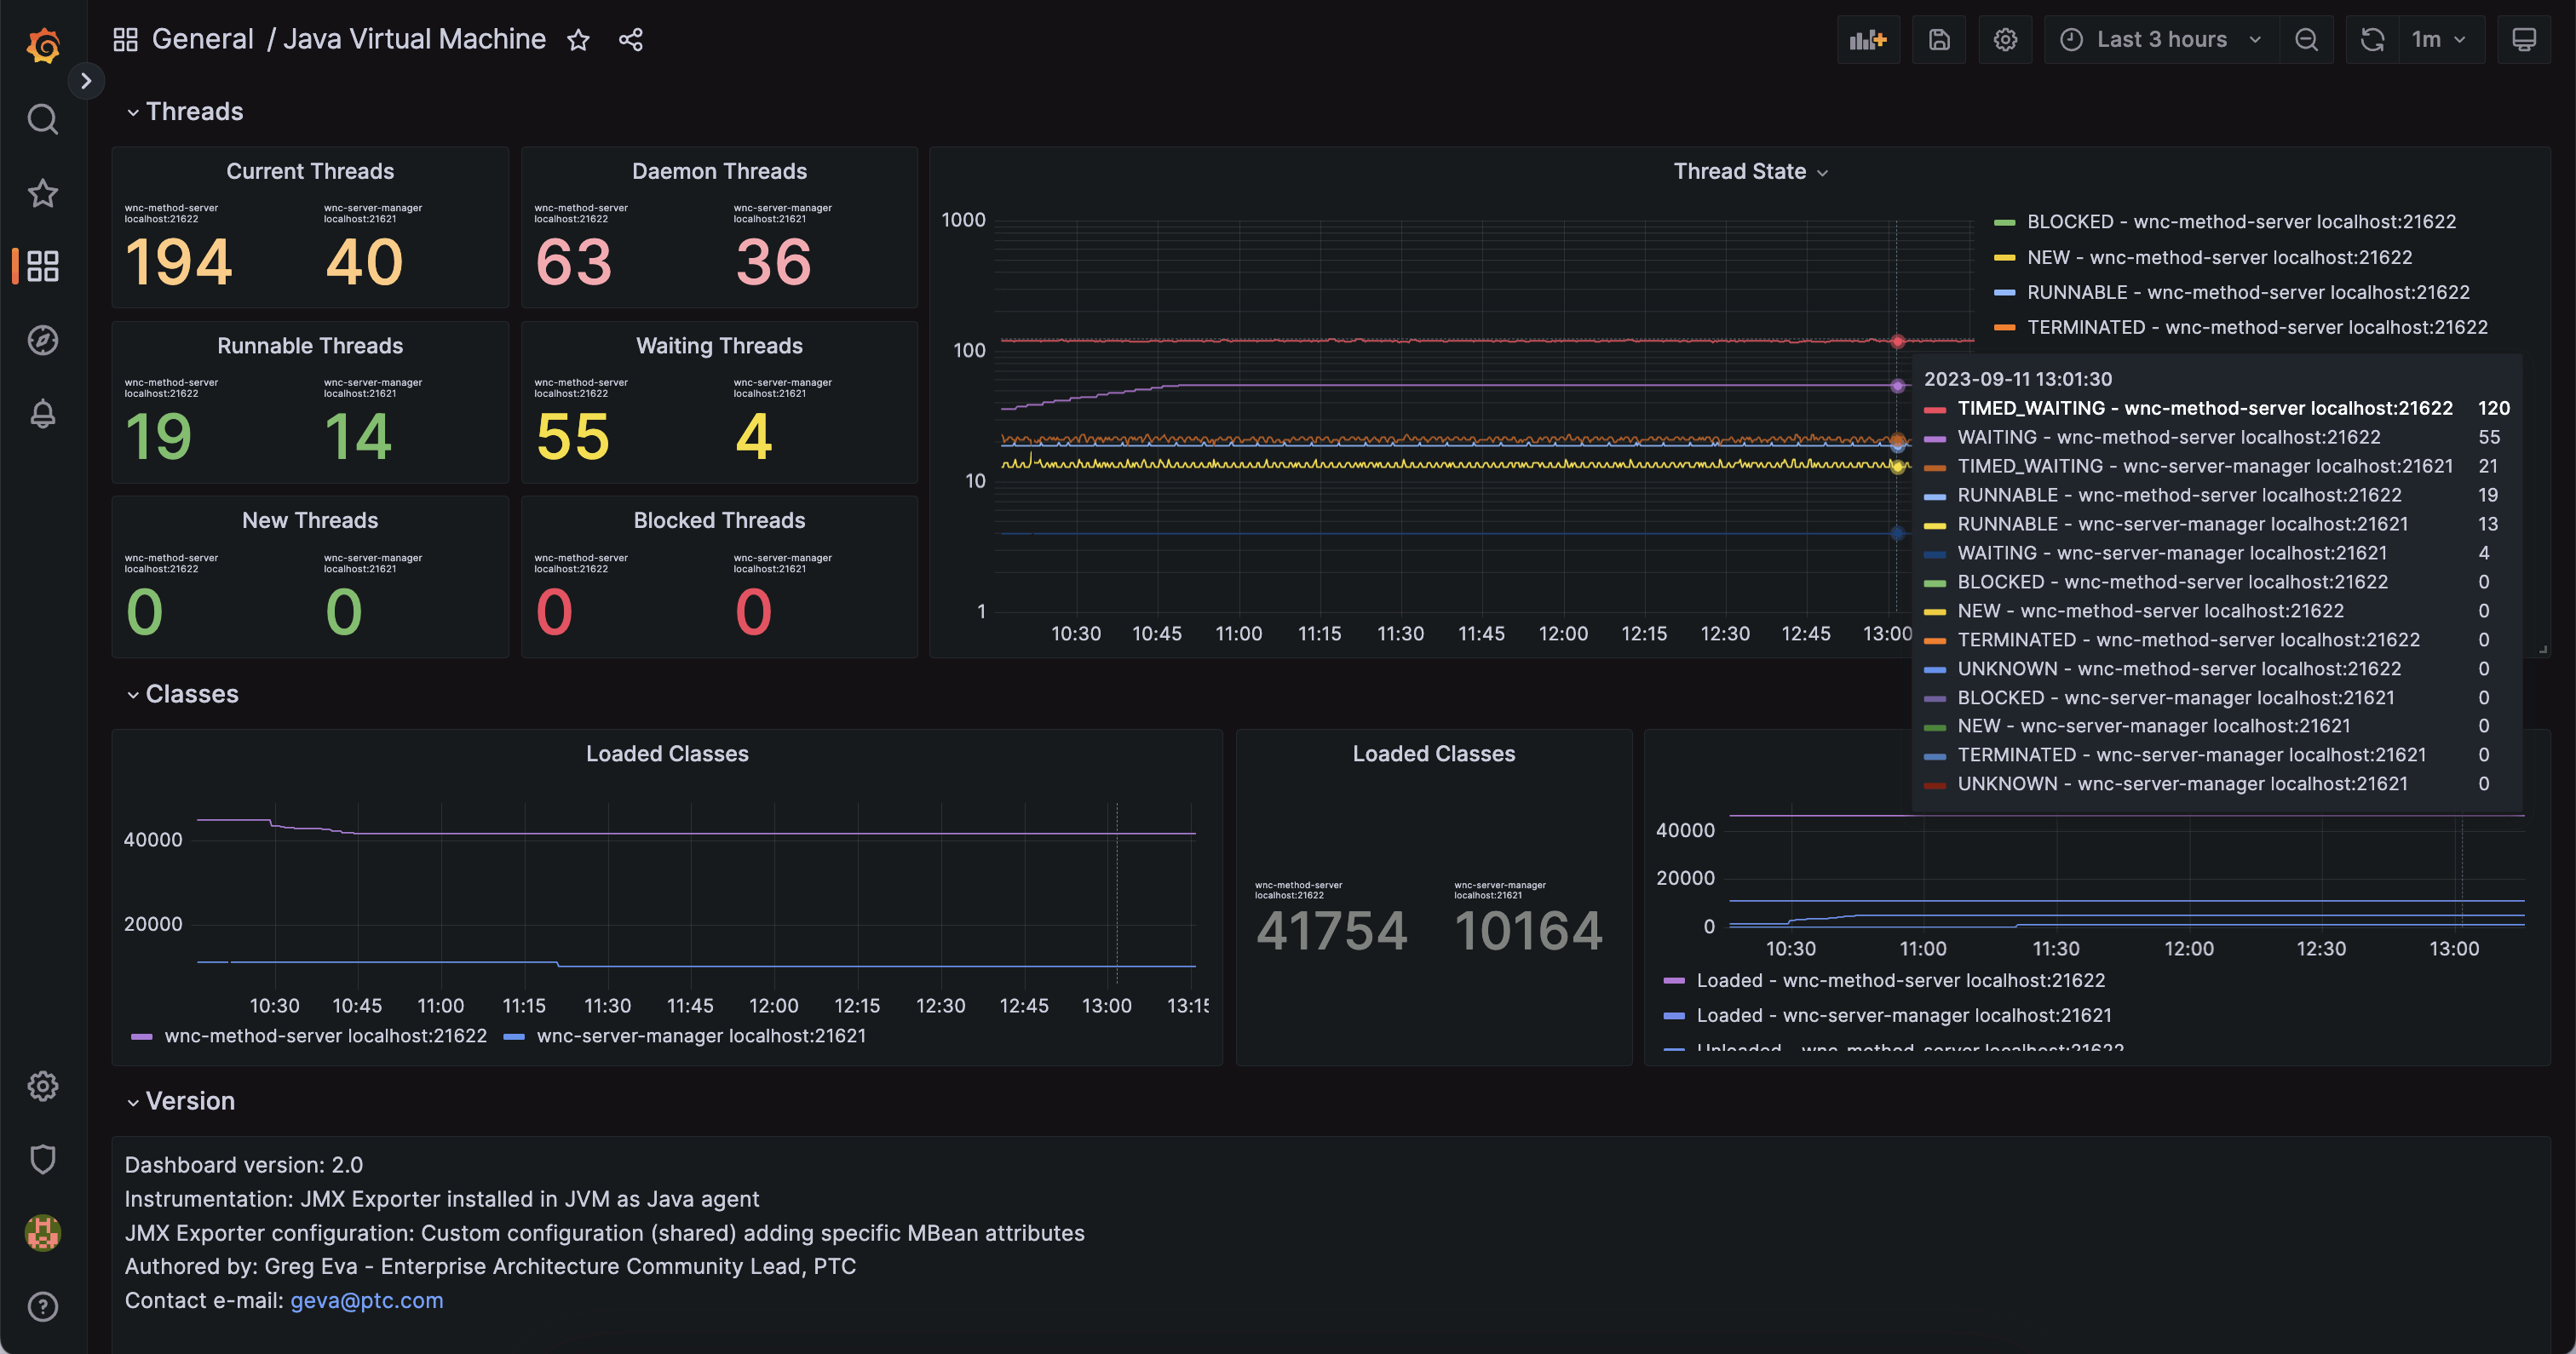
v2.2 - add thread states terminated, timed waiting, align colors
The following JMX Exporter configuration selectively collects specific relevant MBean attributes from the Java Virtual Machine. Contrary to using a wildcard pattern, this allows for specifically applying labels with things like pool names, as well as standardising on metric names across JVM versions and configurations.
You might note the commented section which I was not able to get working. Please contact me if you can help to get these two missing specific call outs working as it would allow to remove the wildcard pattern for the missing one or two essential metrics.
You'll even find an overview and use of this dashboard on my YouTube channel. https://youtu.be/27Yc3gdeuQ0?si=zXXFy26k7iplBRrN
---
# Configuration by Greg Eva (geva@ptc.com) - please contact for questions or suggested changes/enhancements
lowercaseOutputLabelNames: false
lowercaseOutputName: true
# Eventually could put back whitelist, however are very specifically pulling only relevant attributes anyway
#whitelistObjectNames: ["java.lang:type=OperatingSystem", "java.lang:type=Memory", "java.lang:type=MemoryPool", "java.lang:type=Threading", "java.lang:type=GarbageCollector", "Catalina:*", "com.mchange.v2.c3p0:*" , "org.apache.commons.pool2:*"]
#blacklistObjectNames: []
rules:
JAVA VIRTUAL MACHINE
-
pattern: 'java.lang<type=OperatingSystem><>(ProcessCpuLoad|SystemCpuLoad|SystemLoadAverage|AvailableProcessors):'
name: jvm_processor_$1
help: Java Virtual Machine processor load for $1
type: GAUGE
-
pattern: 'java.lang<type=OperatingSystem><>(\w+)FileDescriptorCount:'
name: jvm_filedescriptor_$1_count
help: Java Virtual Machine open and maximum file descriptors
type: GAUGE
-
pattern: 'java.lang<type=OperatingSystem><>(TotalSwapSpace|FreeSwapSpace|TotalPhysicalMemorySize|FreePhysicalMemorySize):'
name: jvm_memory_$1_bytes
help: Java Virtual Machine memory for $1
type: GAUGE
-
pattern: 'java.lang<type=Threading><>(CurrentThreadCpuTime|CurrentThreadUserTime):'
name: jvm_threads_$1_total
help: Java Virtual Machine threads for $1
type: COUNTER
-
pattern: 'java.lang<type=Memory><(\w+)MemoryUsage>(\w+): (\d+)'
name: jvm_memory_bytes_$2
labels:
area: "$1" # Heap/NonHeap
value: $3
type: GAUGE
Skipping GC related metrics, as they come in with the Java agent exporter implementation (not HTTP server)
Ideally I would like these two metrics, but I cannot get the JMX query to work
LastGcInfo before and after memory details not needed as present on jvm_memory_pool_allocated_bytes_total
#- pattern: 'java.lang<name=([-a-zA-Z0-9+/$%~_-|!.]*),type=GarbageCollector><LastGcInfo>(GcThreadCount|duration)'
name: jvm_gc_$2
labels:
pool: $1
help: Java Virtual Machine garbage collection for $1
type: GAUGE
You will then need to either change your Java application service to include the JMX Exporter as a Java agent, or add it to the JAVA_OPTS so that the exporter with associated configuration file will be loaded with the JVM.
-javaagent:/opt/jmx_exporter/jmx_prometheus_javaagent-0.20.0.jar=9111:/opt/jmx_exporter/jmx-exporter-config.yaml
And then add the relevant Prometheus scrape configuration for the above JMX Exporter configuration. Consult the Prometheus documentation should you need to enhance it.
  - job_name: 'jmx'
static_configs:
- targets: ['wer-twx-foundation:9111', 'wer-twx-iothubconnector:9111']
You'll note the YAML list which allows adding multiple servers to scrape. You can break these out across multiple lines if you wish to apply specific application or other labels as a part of the scrape. Example:
    - targets:
      - simulator.japaneast.cloudapp.azure.com:9111
      labels:
        group: Simulators
        region: Japan
    - targets:
      - simulator.centralus.cloudapp.azure.com:9111
      labels:
        group: Simulators
        region: USA
    - targets:
      - simulator.germanywestcentral.cloudapp.azure.com:9111
      labels:
        group: Simulators
        region: Germany
    - targets:
      - simulator.koreacentral.cloudapp.azure.com:9111
      labels:
        group: Simulators
        region: Korea
Data source config
Collector config:
Upload an updated version of an exported dashboard.json file from Grafana
| Revision | Description | Created | |
|---|---|---|---|
| Download |
Java Virtual Machine (JVM)
Easily monitor a Java virtual machine, which allows computers to run Java programs, with Grafana Cloud's out-of-the-box monitoring solution.
Learn more