FlareSolverr
A dashboard for the FlareSolverr Prometheus exporter: https://github.com/FlareSolverr/FlareSolverr
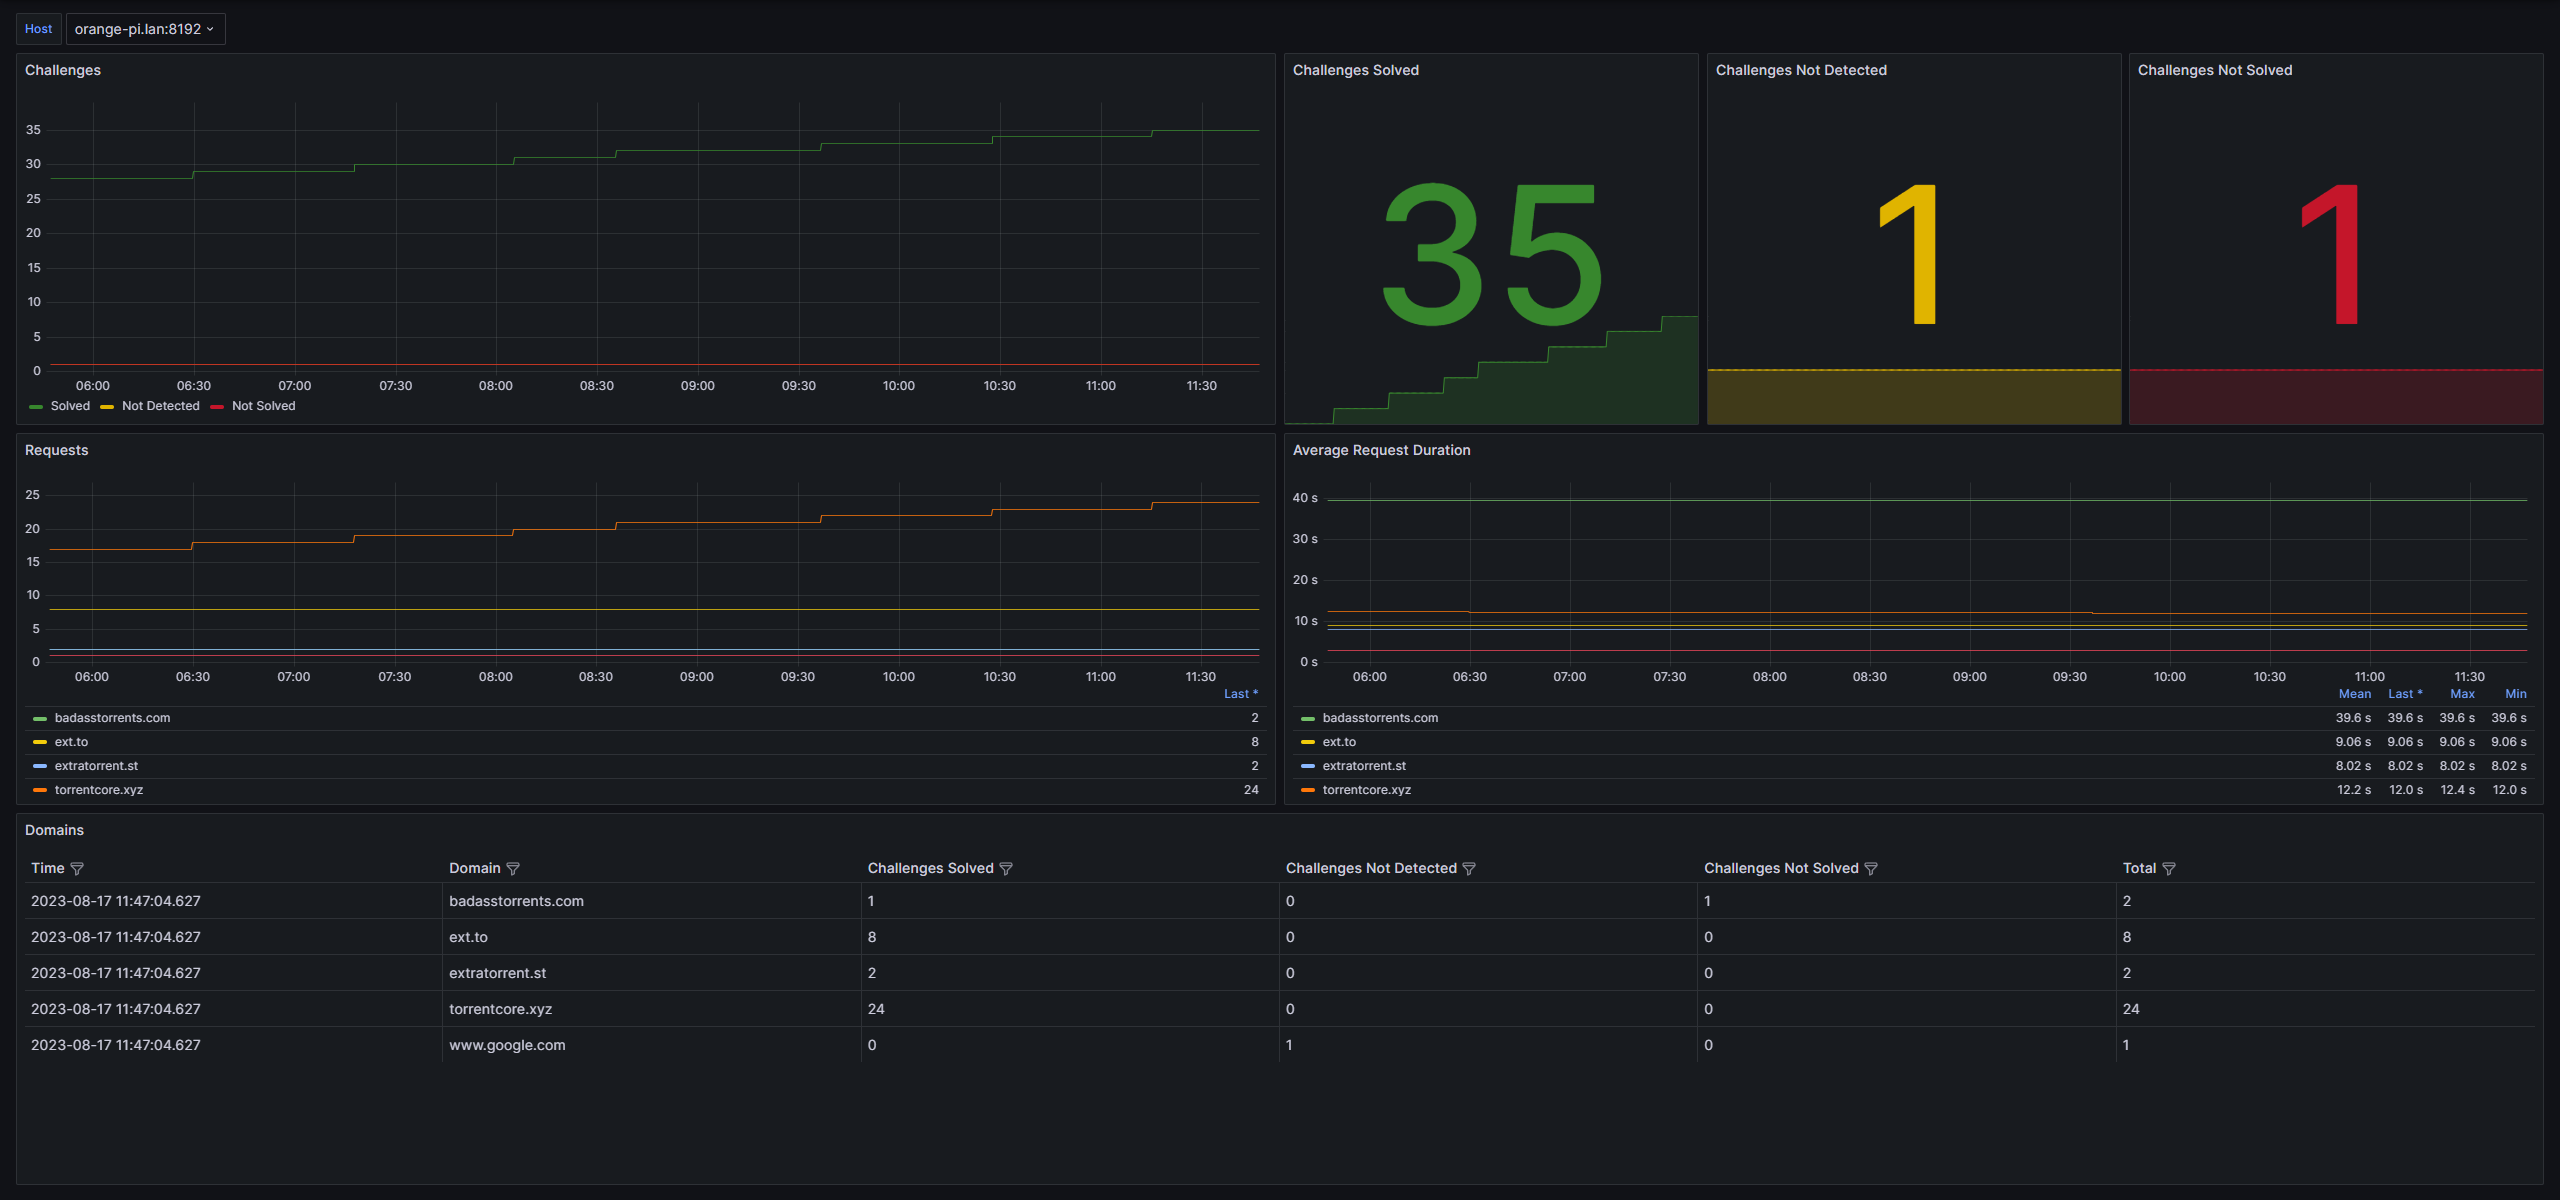
This dashboard shows many statistics for your instance of FlareSolverr, including challenges solved, challenges not detected, and challenges not solved, as well as the average request duration for each domain. It also shows per-domain challenge statistics.
To get started, add a FlareSolverr job to your prometheus.yaml file, likely located in the /etc/prometheus directory:
- job_name: "flaresolverr_exporter"
  static_configs:
    - targets: ["localhost:8192"]
Data source config
Collector config:
Upload an updated version of an exported dashboard.json file from Grafana
| Revision | Description | Created | |
|---|---|---|---|
| Download |

