
z/VM Memory and Paging
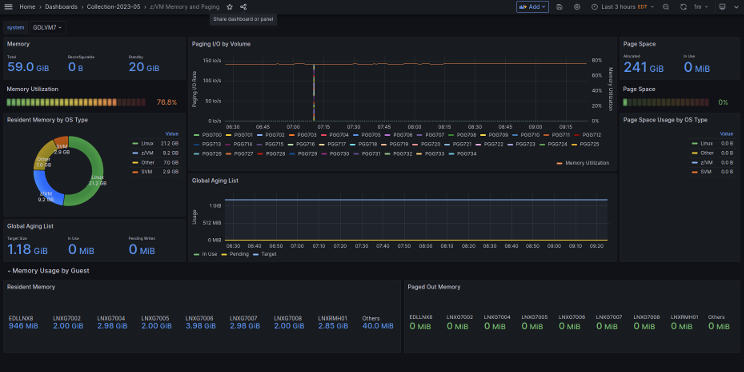
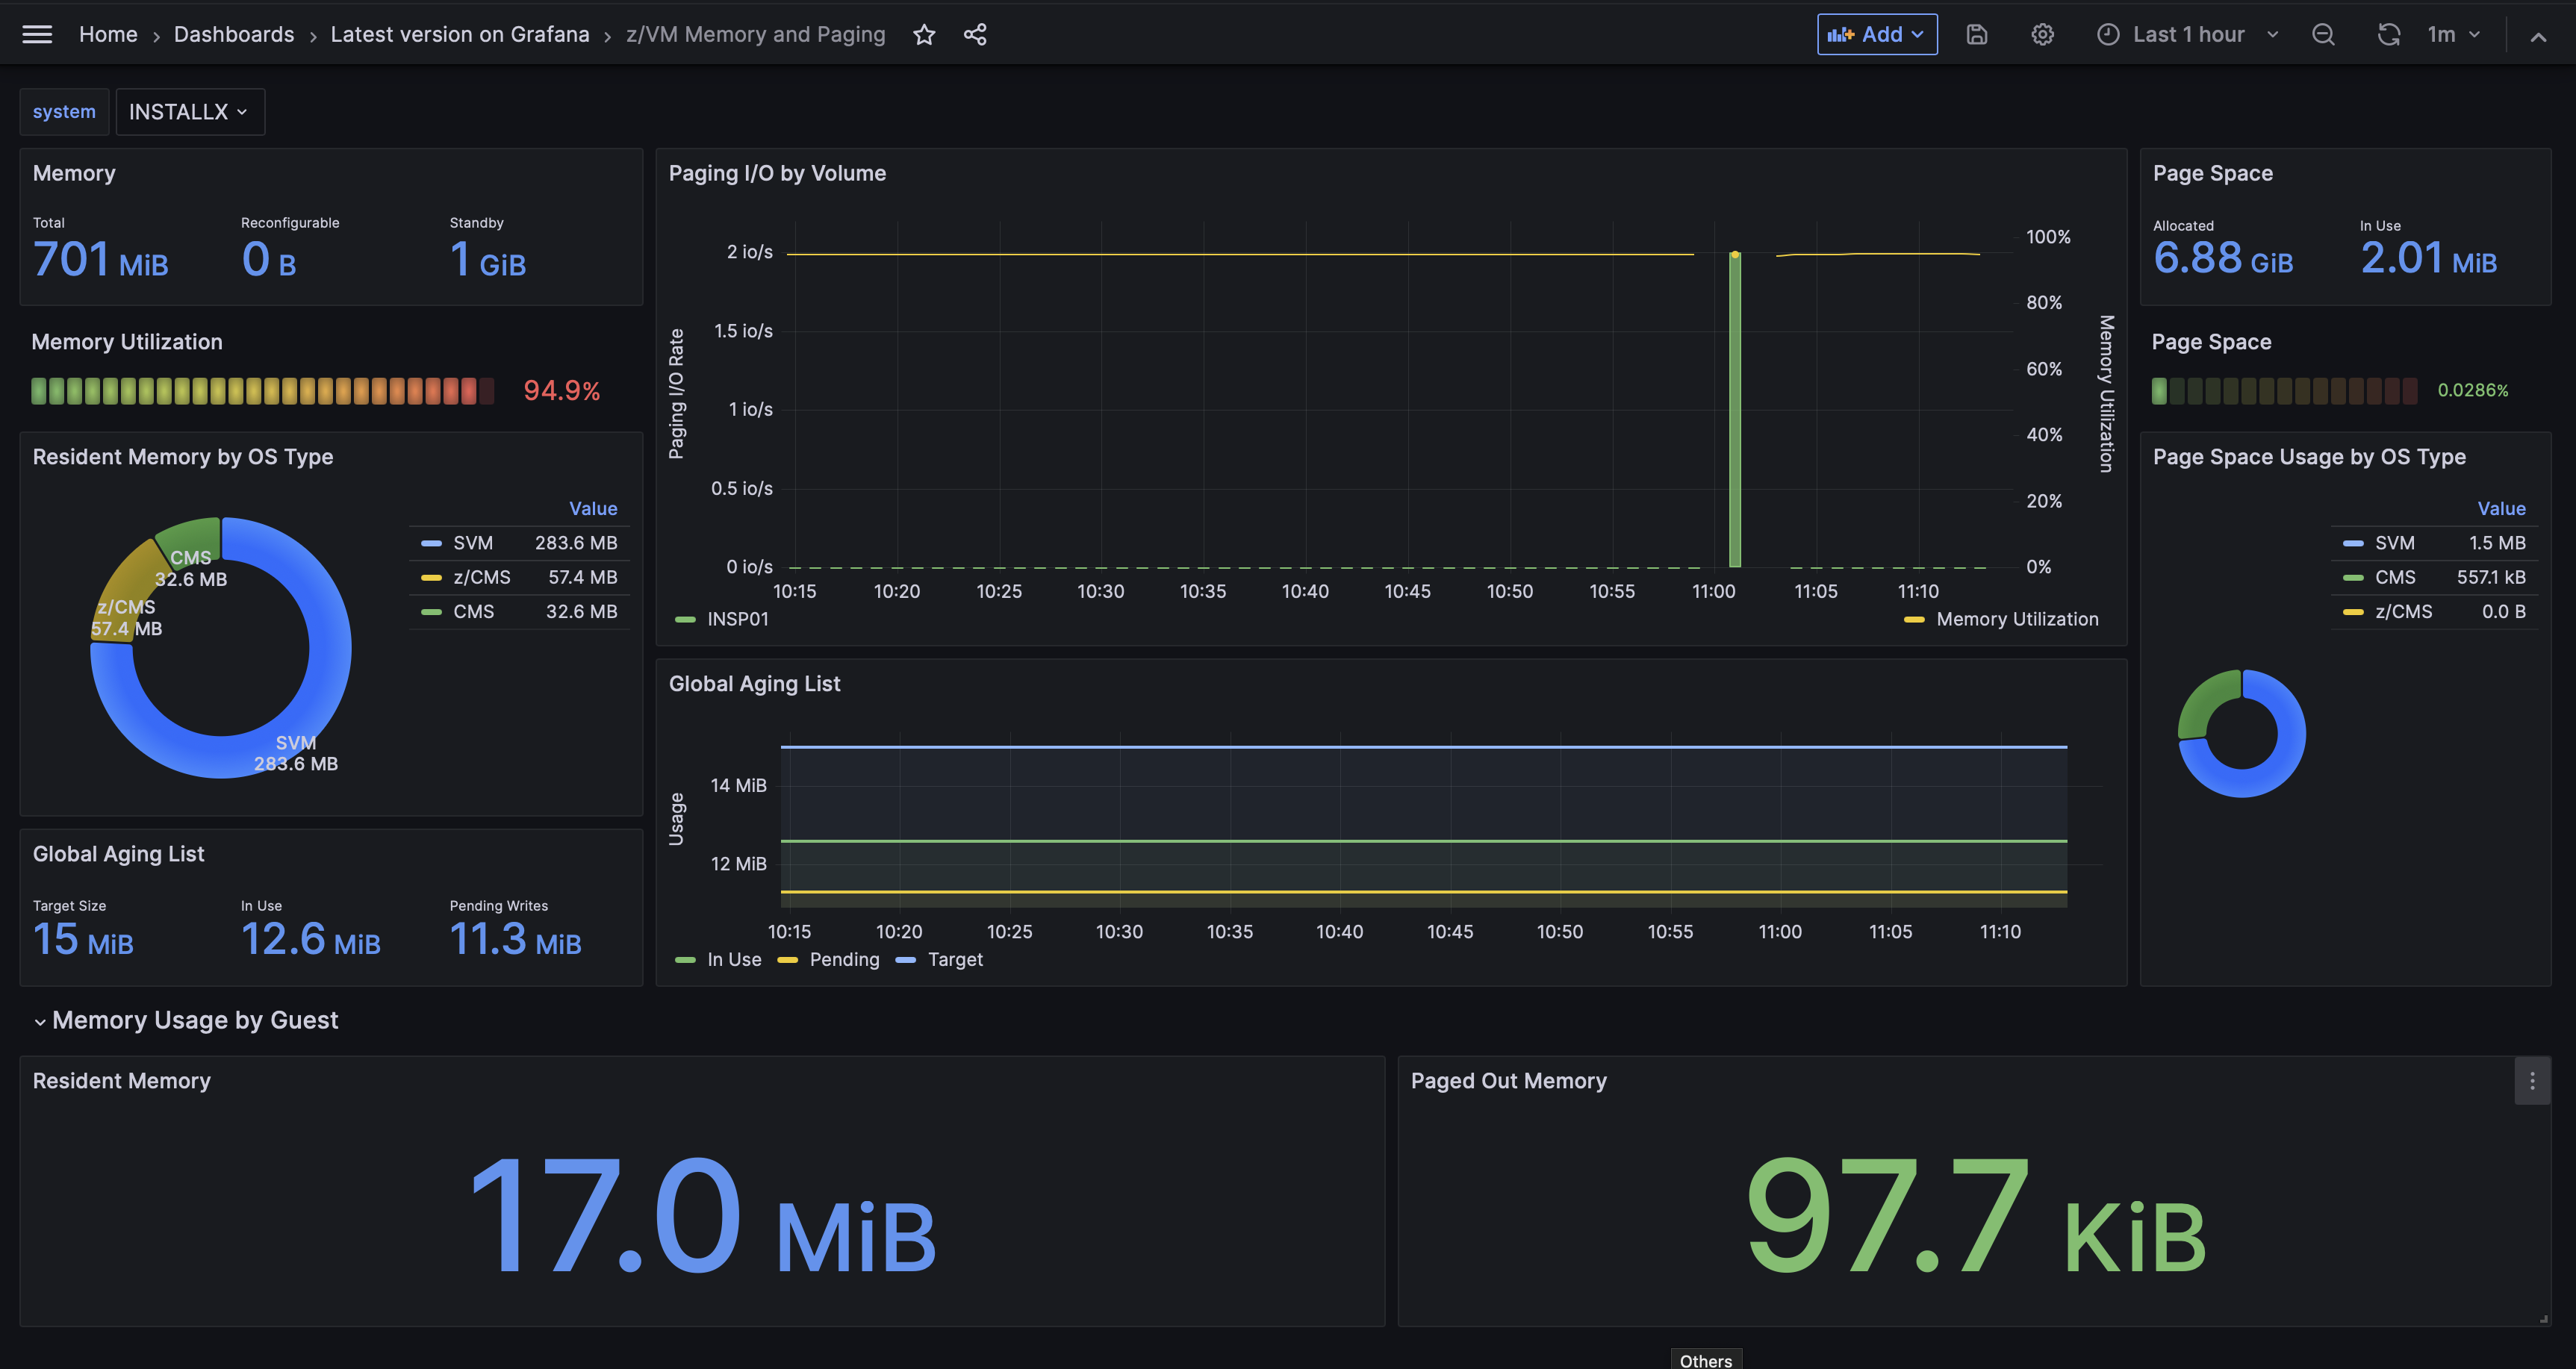
The dashboard shows memory usage and paging in a single z/VM® system. Simple meters shows the current utilization, while charts visualize trends from recent history. Charts provide a breakdown of usage by user class, and show key metrics of the global aging list. Detailed breakdown of memory and paging usage by Linux guest is also shown. The dashboard is populated by the default set of metrics provided by the z/VM Performance Data Pump.
This dashboard is licensed by IBM under the Apache 2.0 License and is provided ‘as is’ without warranty, representation, support, maintenance or an obligation to issue updates.
Data source config
Collector type:
Collector plugins:
Collector config:
Revisions
Upload an updated version of an exported dashboard.json file from Grafana
| Revision | Description | Created | |
|---|---|---|---|
| Download |