Telegraf with Flux
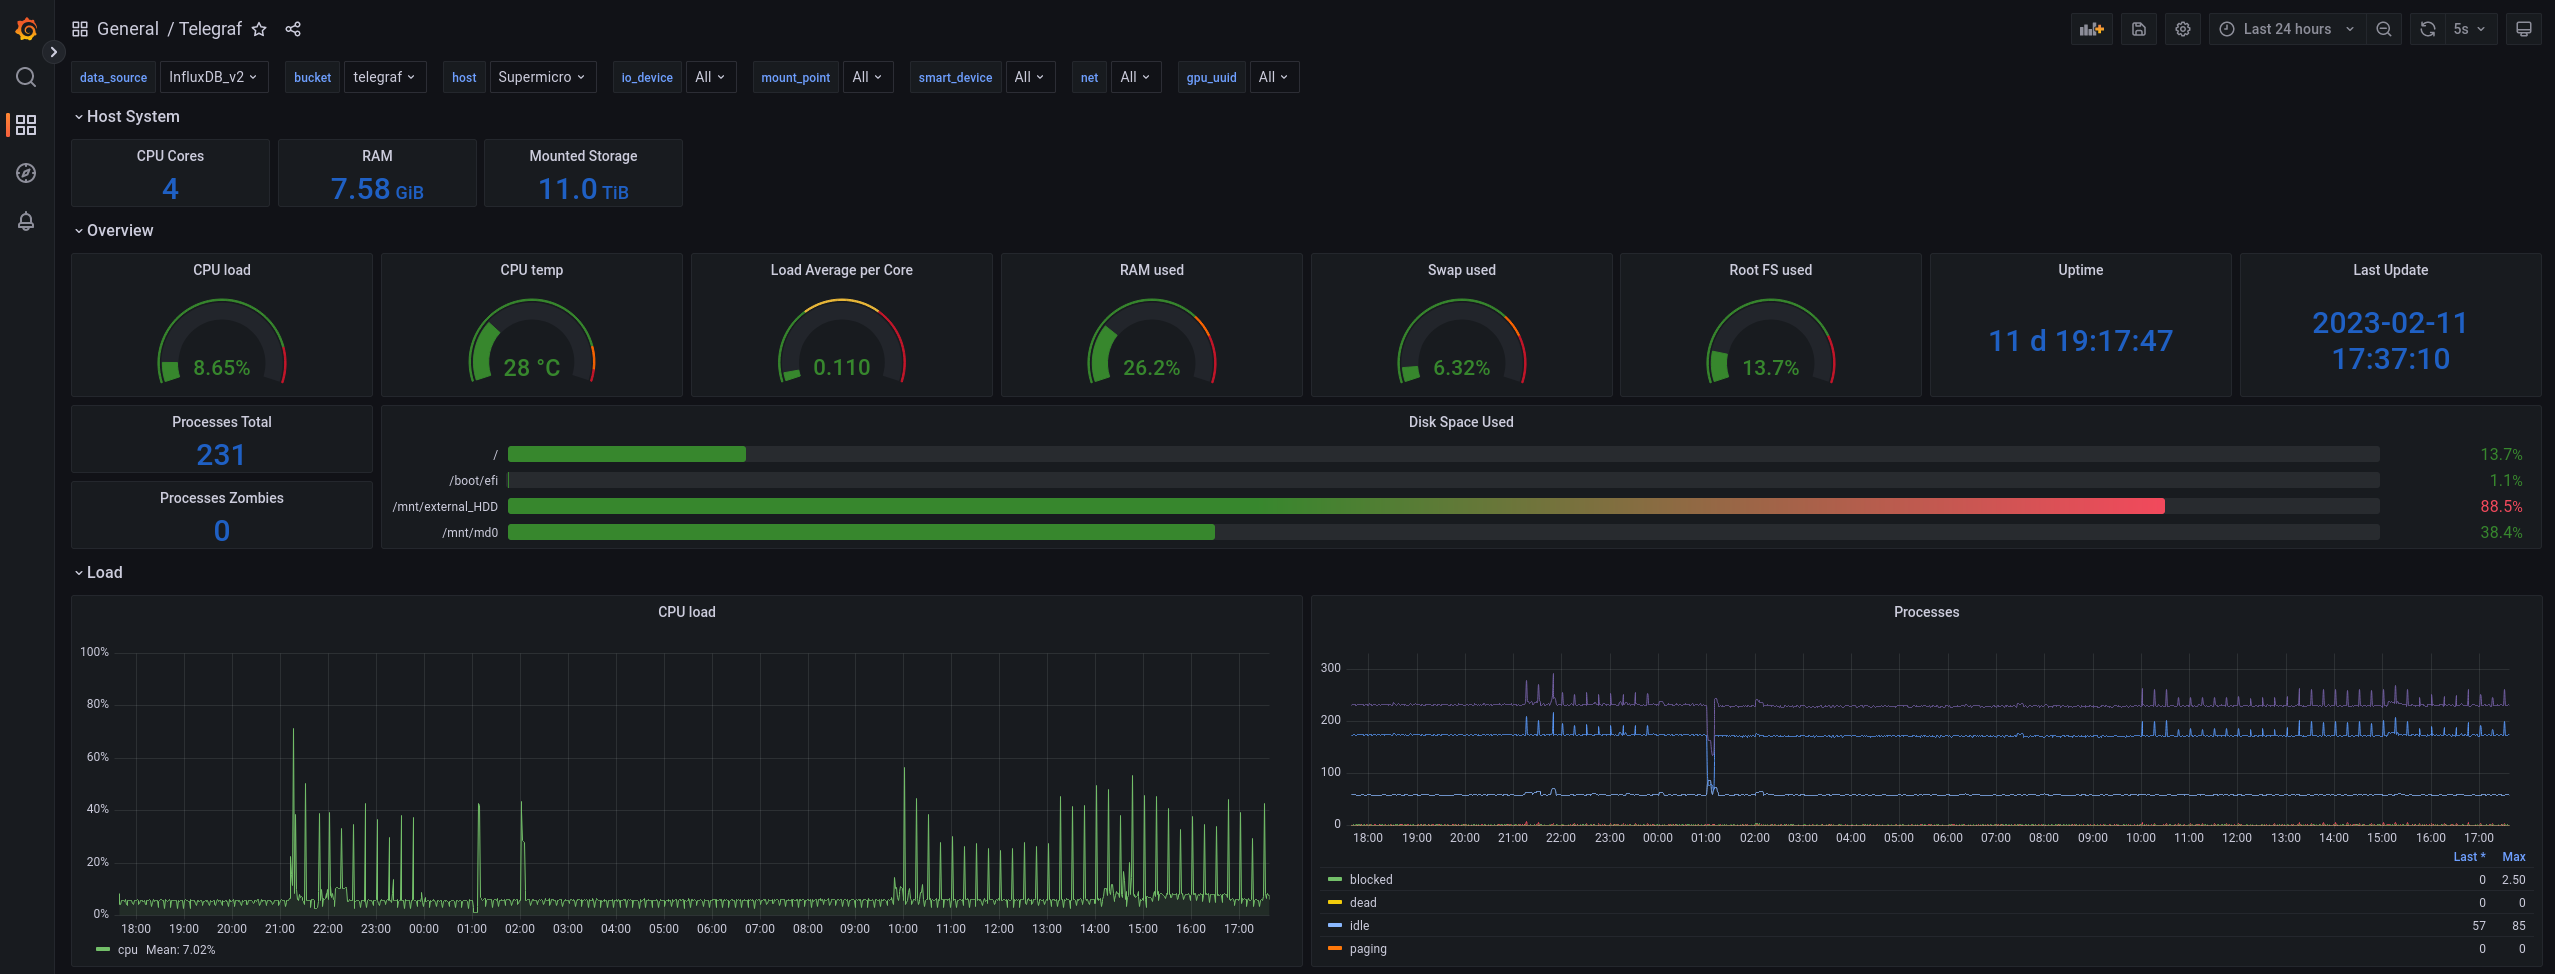
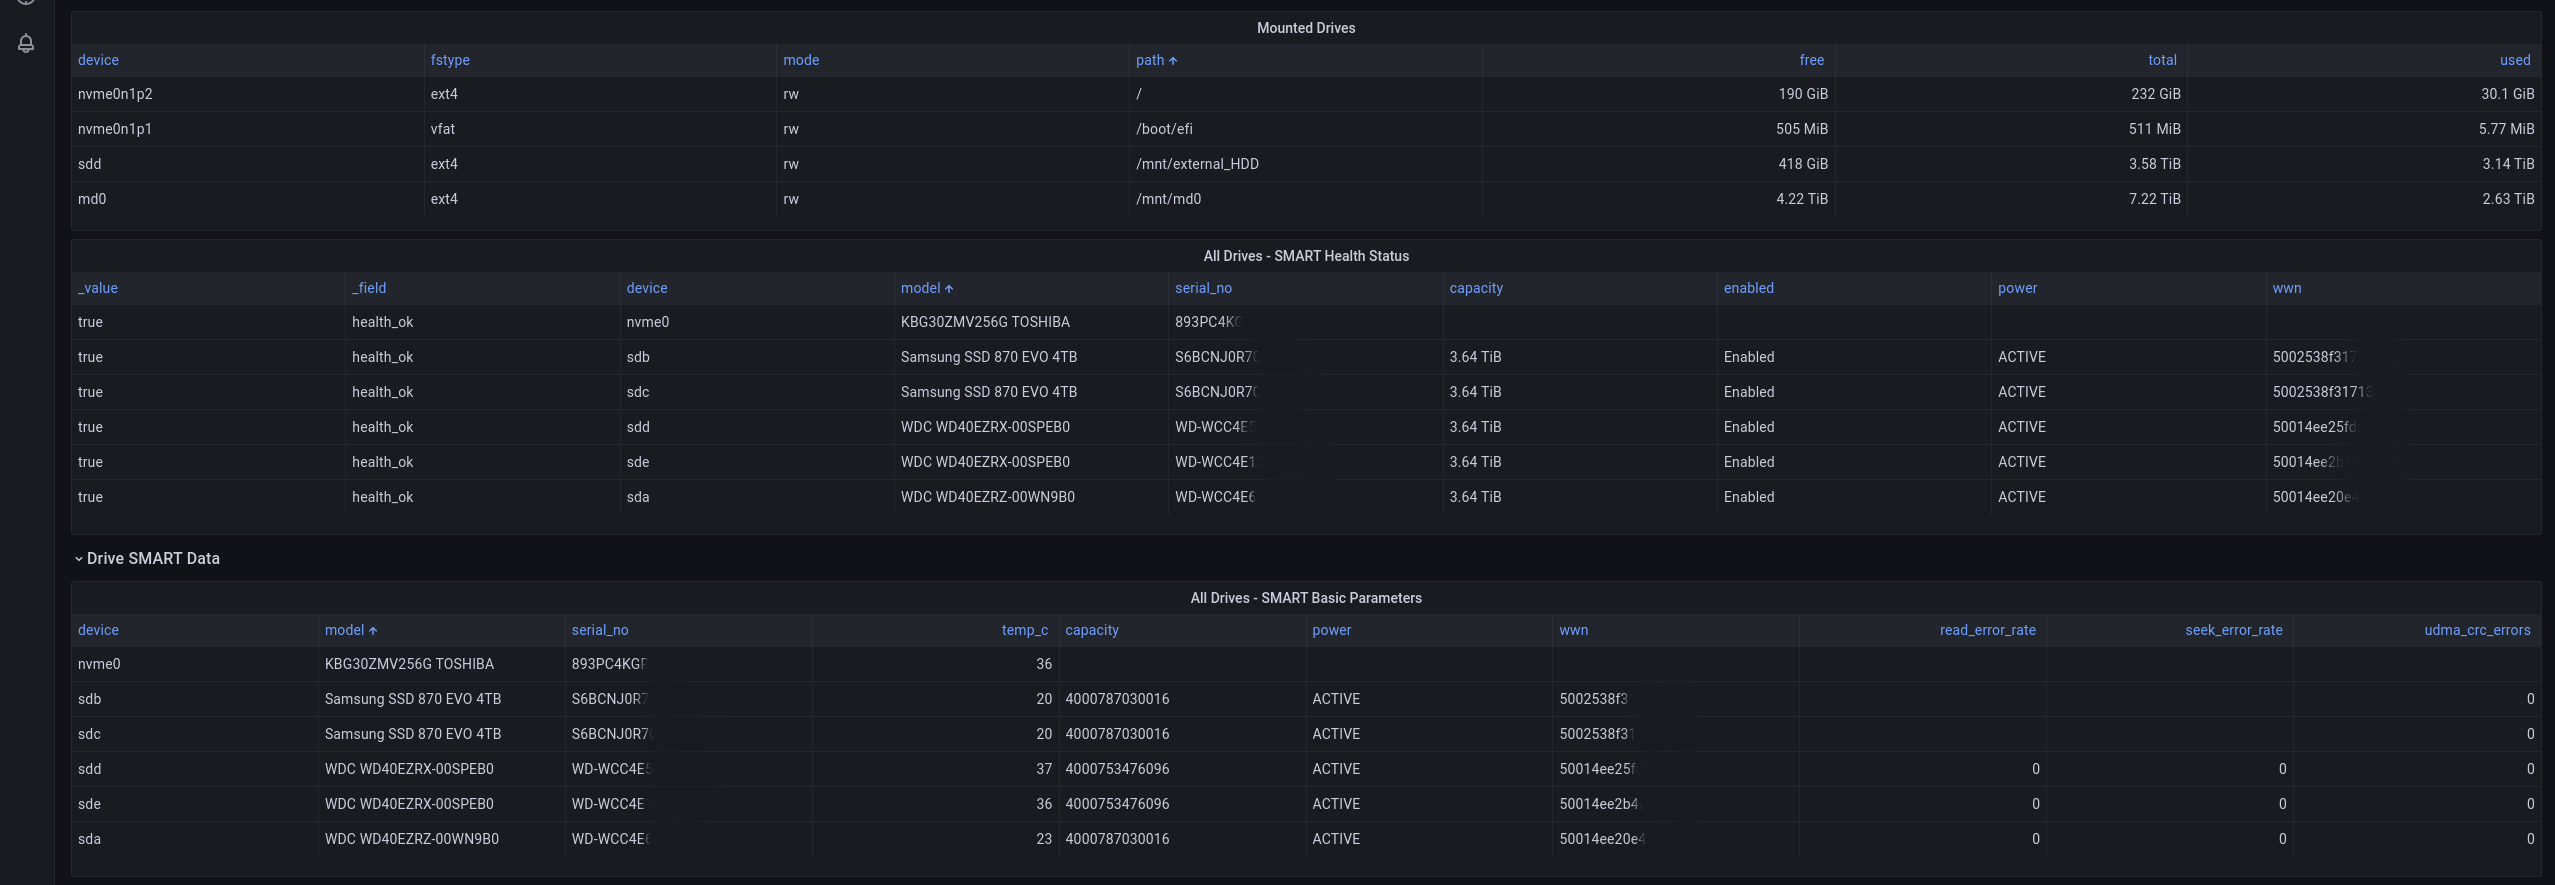
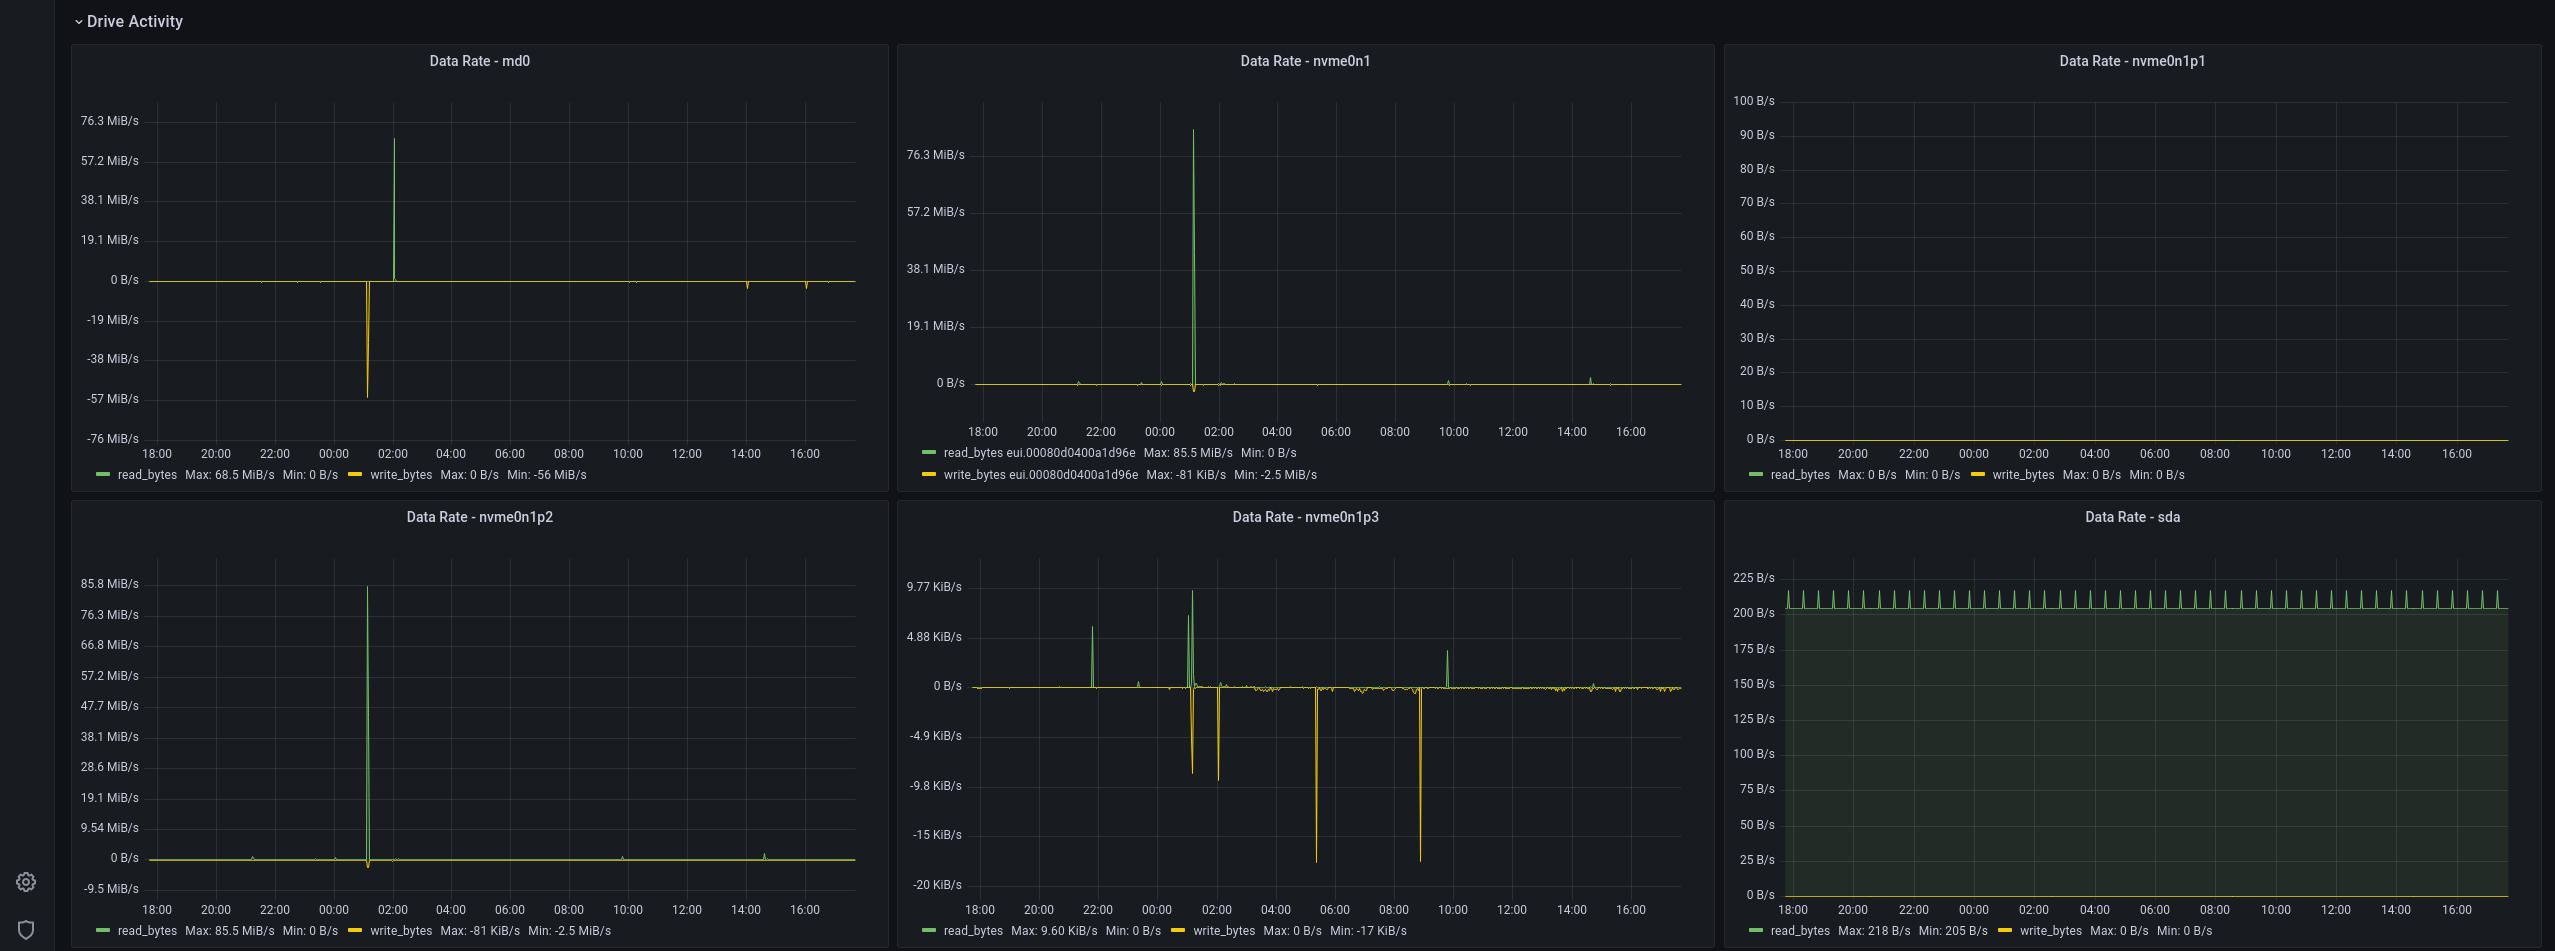
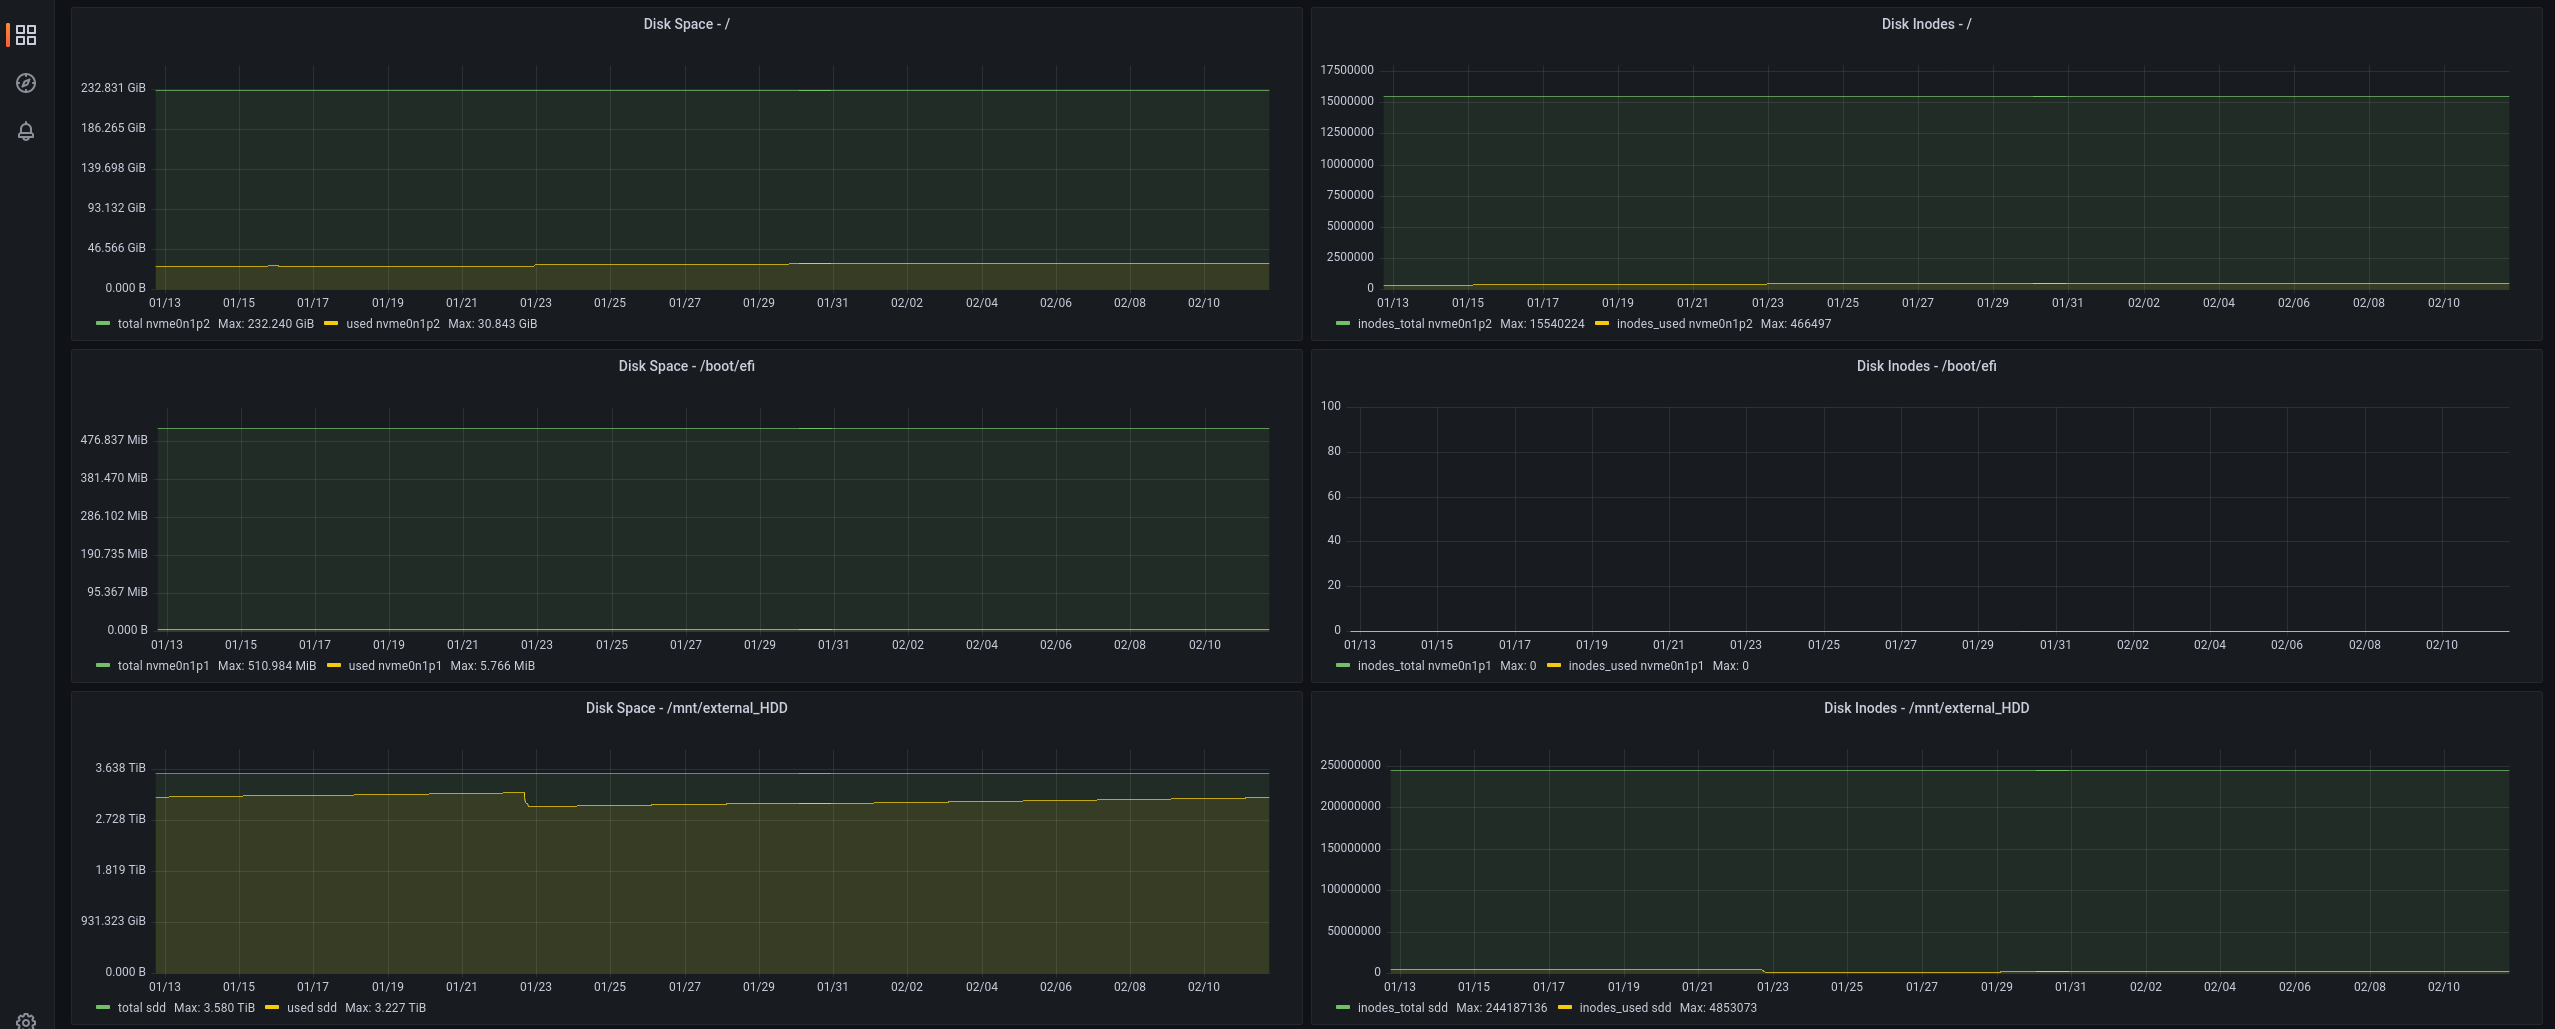
Basic health and usage monitoring of any host running Telegraf. All queries are written in flux, requireing influxdb 2.x. Ansible playbook to configure the host and the correct telegraf configuration to provide these metrics to influxdb_v2 are provided on github: https://github.com/DamianHurschler/grafana_dashboard_telegraf
Data source config
Collector config:
Upload an updated version of an exported dashboard.json file from Grafana
| Revision | Description | Created | |
|---|---|---|---|
| Download |


