VictoriaMetrics - operator
Overview for operator VictoriaMetrics v0.25.0 or higher
VictoriaMetrics operator overview
Requirements
VictoriaMetrics operator: each revision may have different VictoriaMetrics operator version requirements.
Grafana: each revision may have different Grafana version requirements.
Configure metrics scraping with Prometheus text exposition format by the compatible collector, such as vmagent, single VictoriaMetrics, Prometheus or any other collector. You can also use VMServiceScrape
Use Prometheus datasource with Prometheus or VictoriaMetrics URL. See more details about how to configure monitoring here.
Description
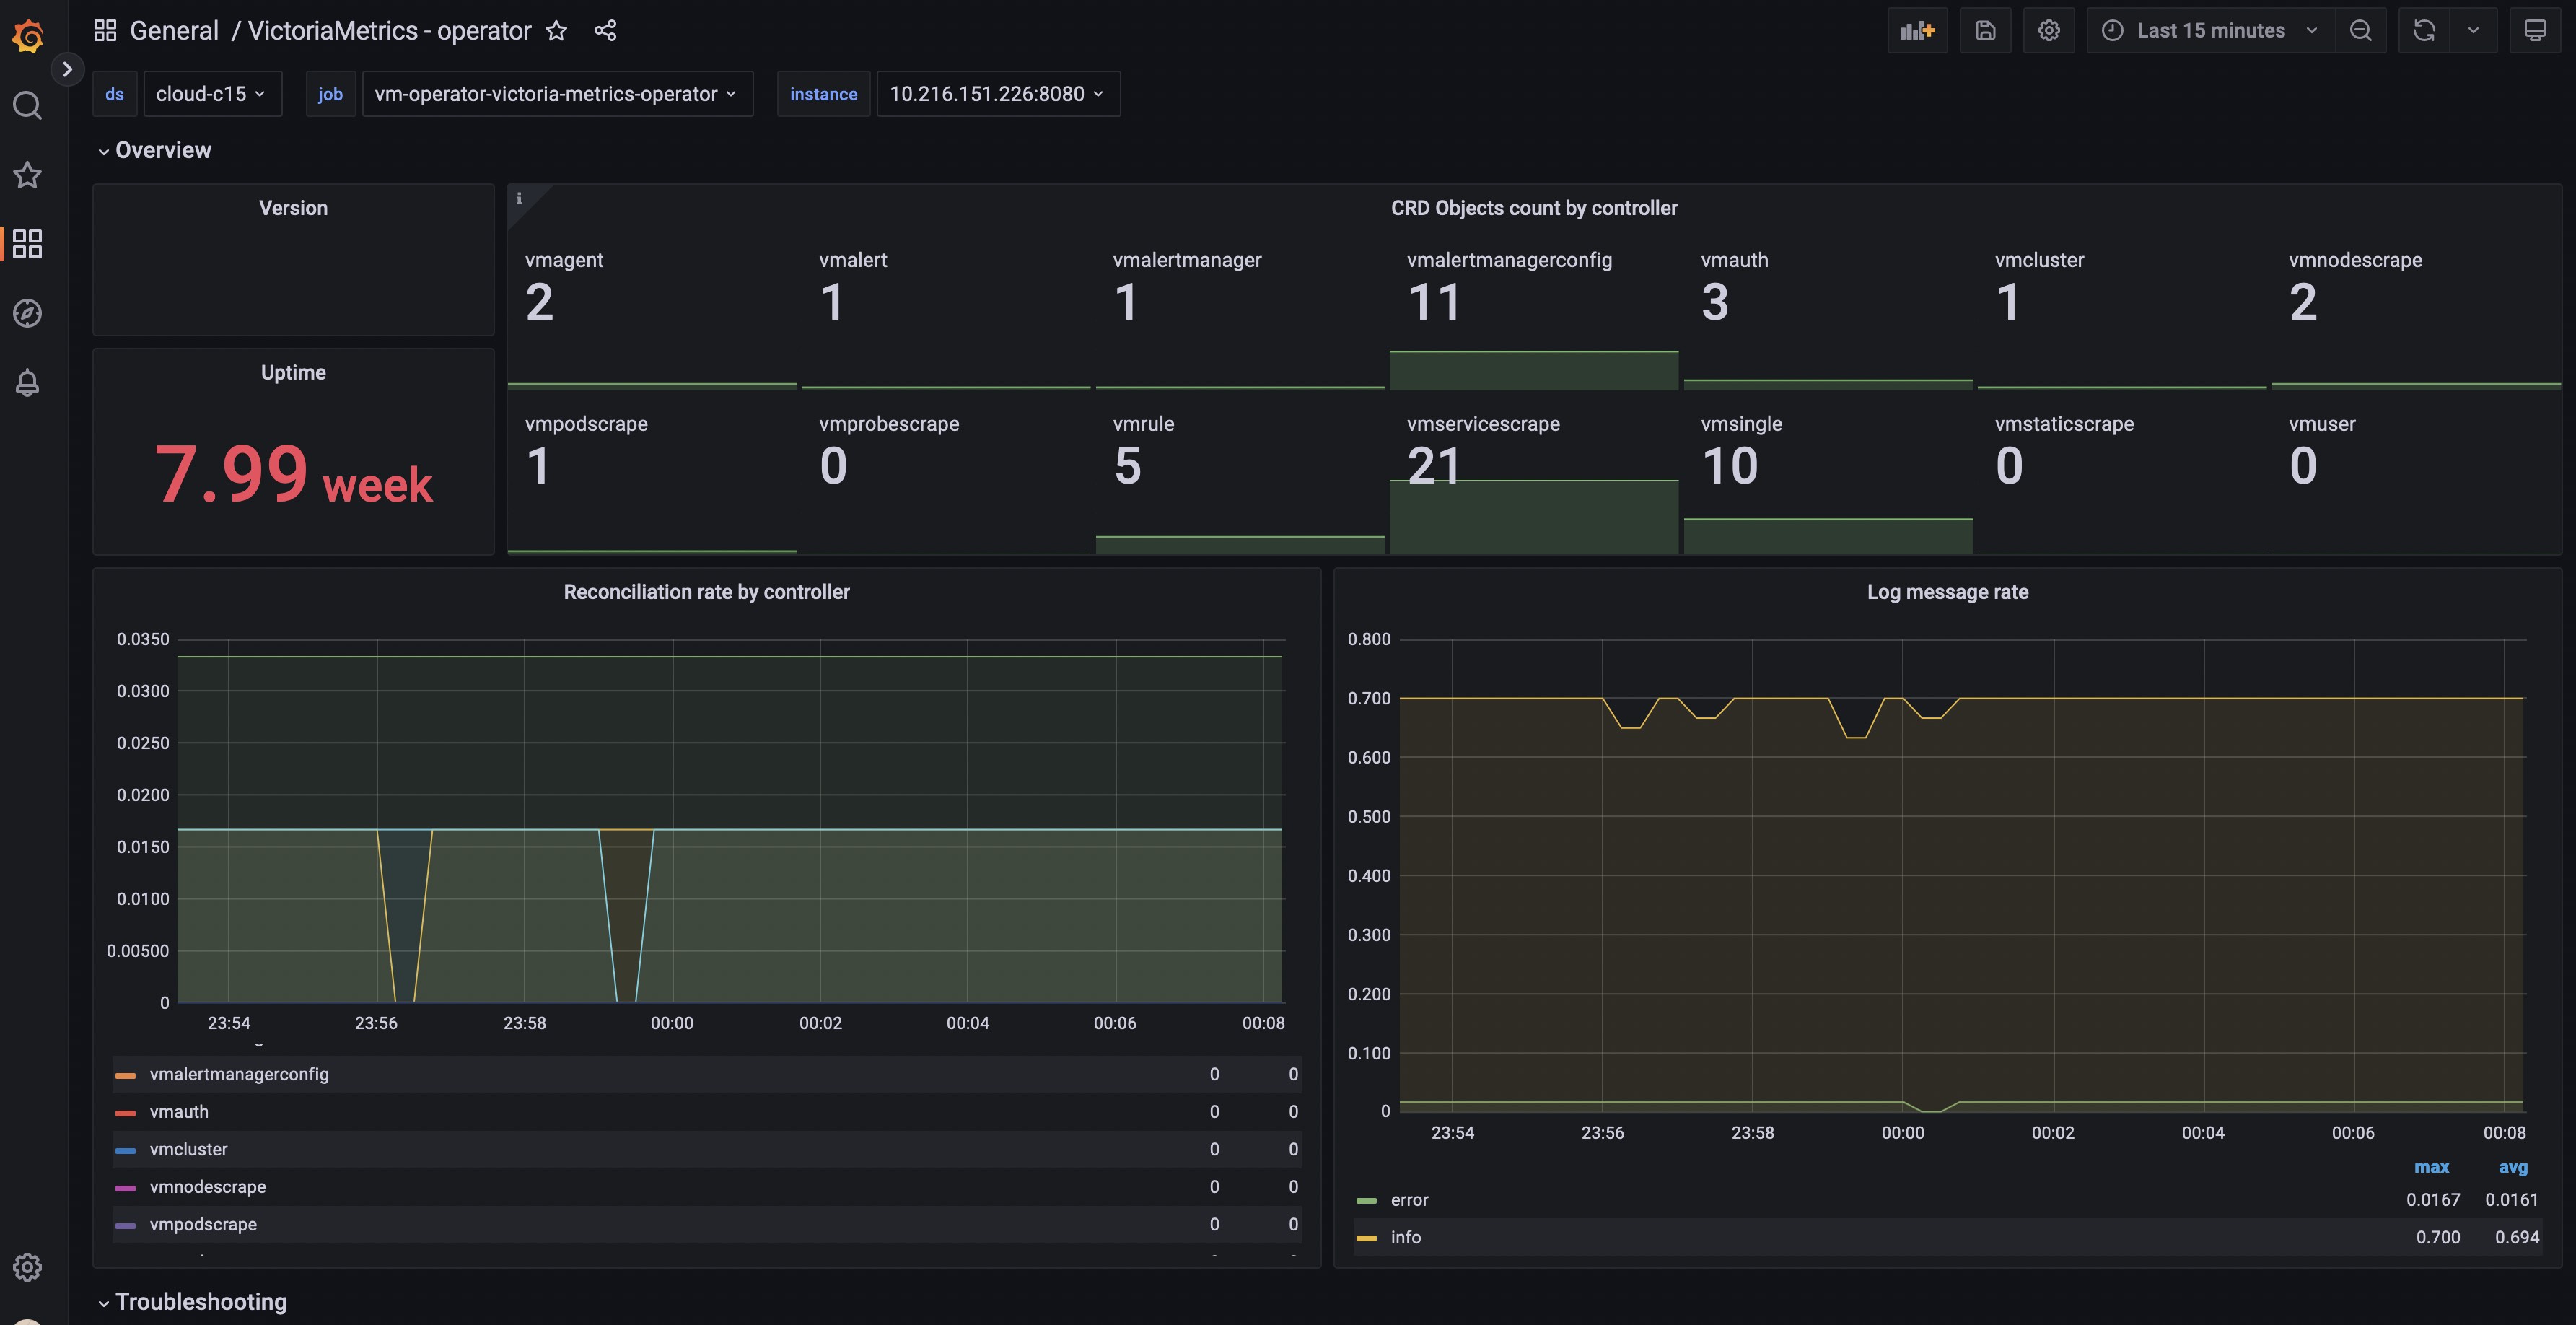
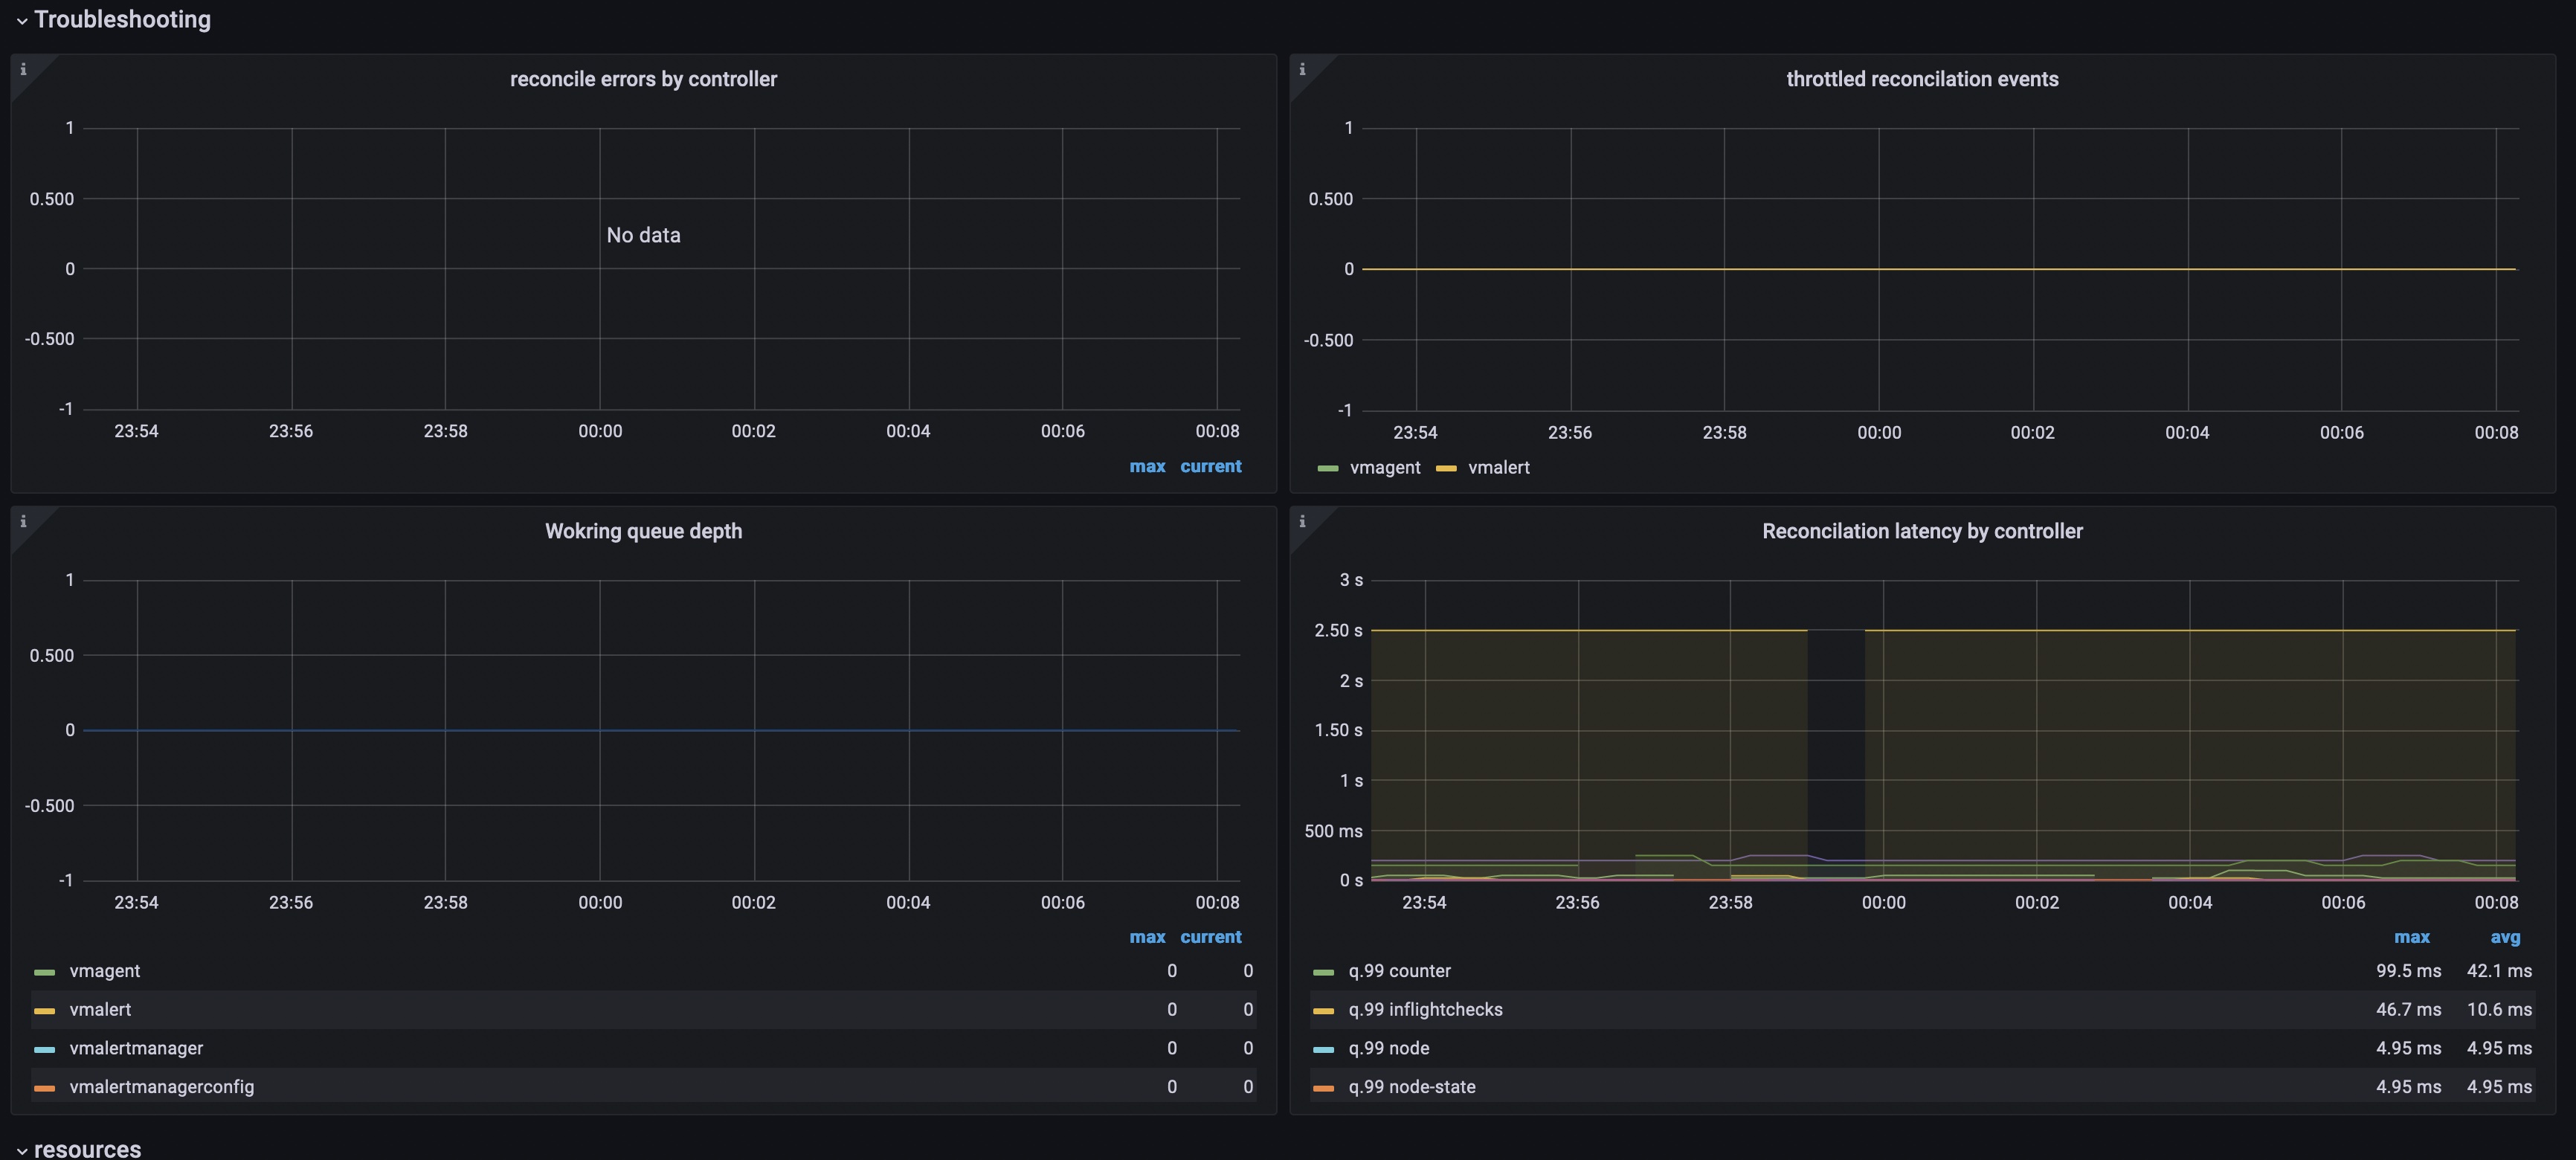
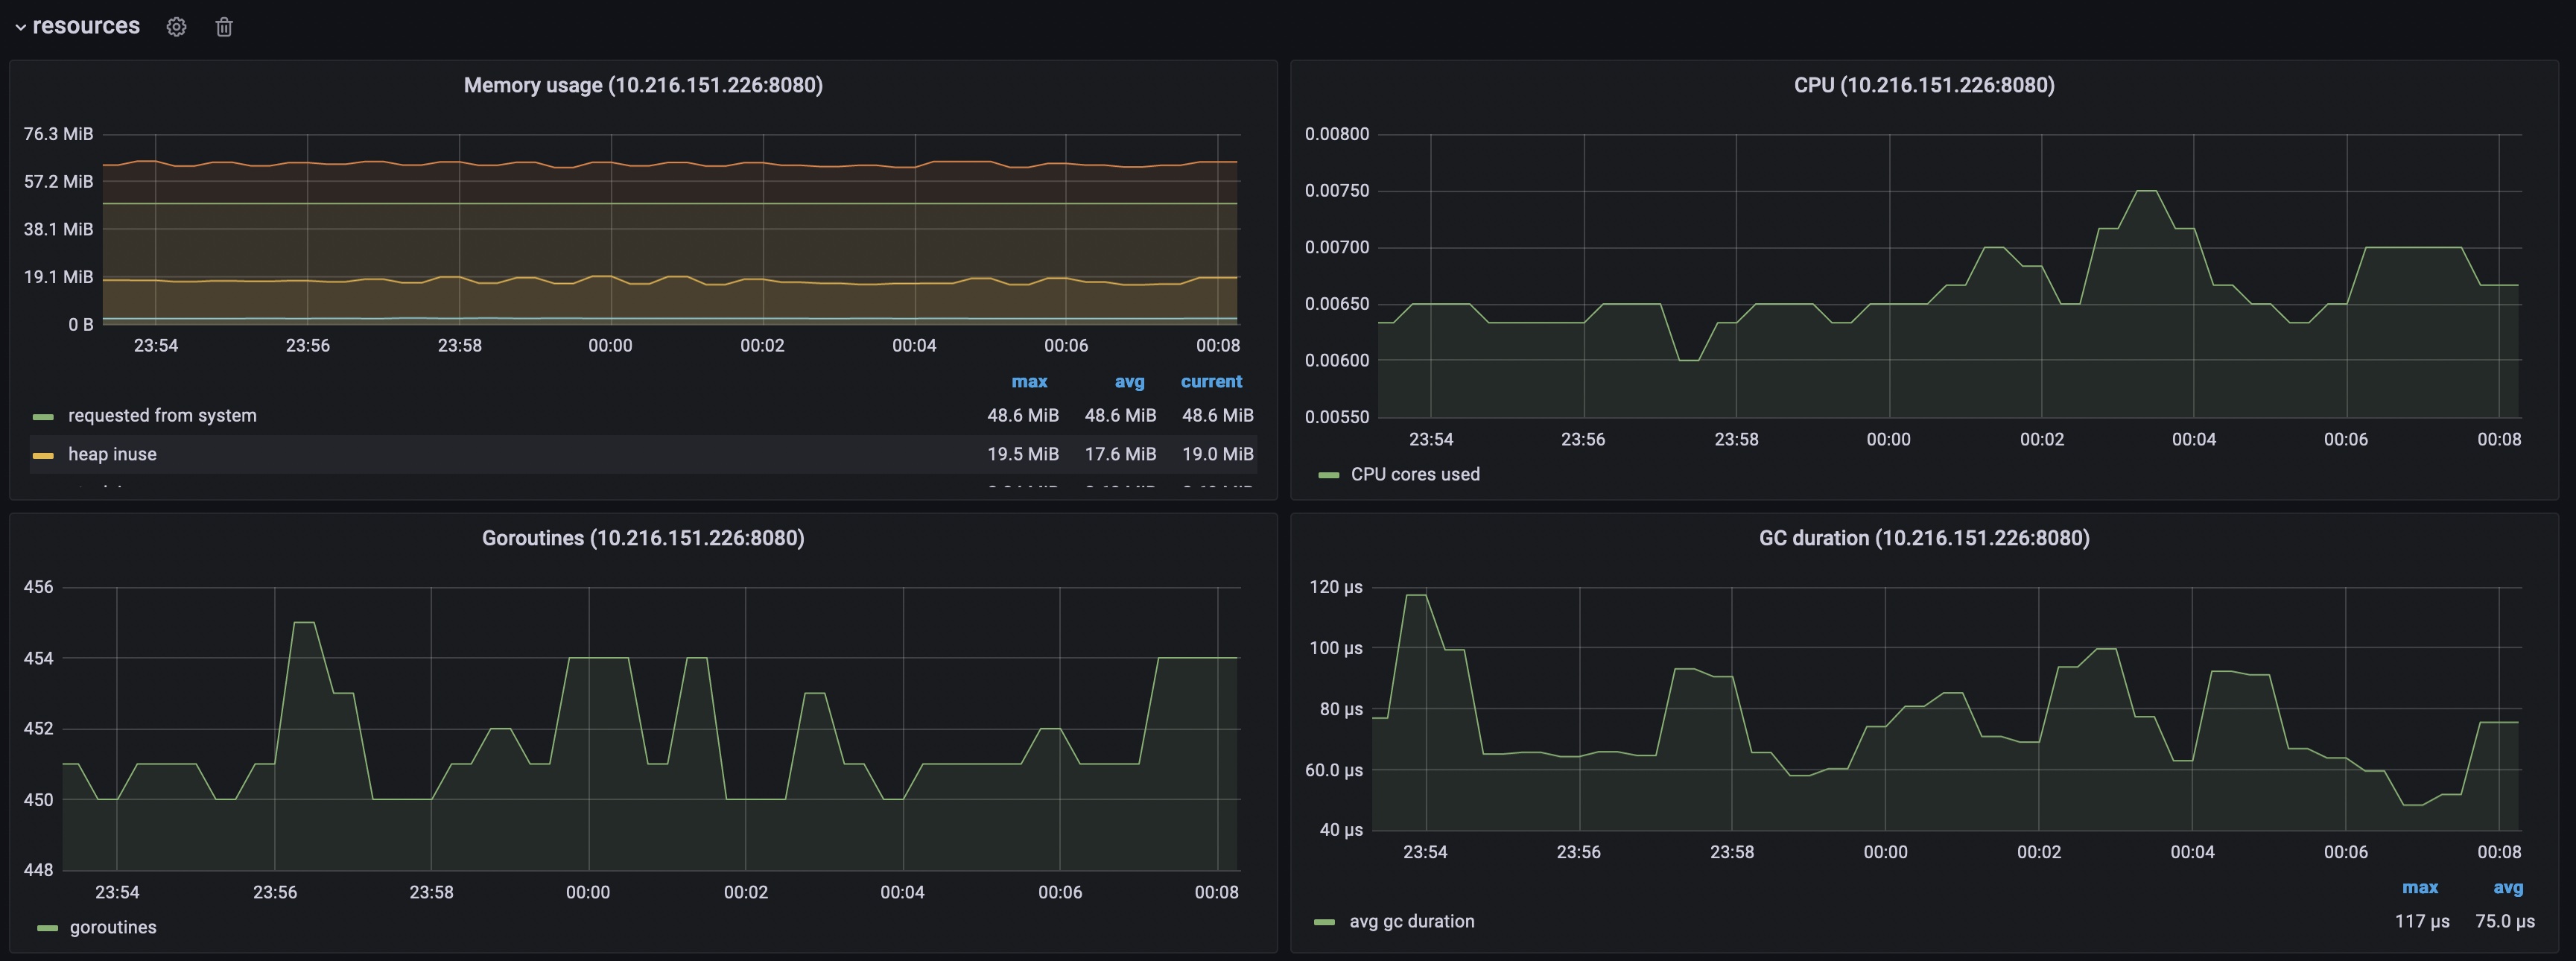
Dashboard contains visualization of the most useful metrics displaying the current state and performance of the service. It covers such aspects as working queue depth, number of managed CRDs, resource utilization and others. If you have suggestions, improvements or found a bug - feel free to add an issue or add a review to the dashboard.
More information about operator and VictoriaMetrics.
New releases.
Data source config
Collector config:
Upload an updated version of an exported dashboard.json file from Grafana
| Revision | Description | Created | |
|---|---|---|---|
| Download |