Linux:Overview
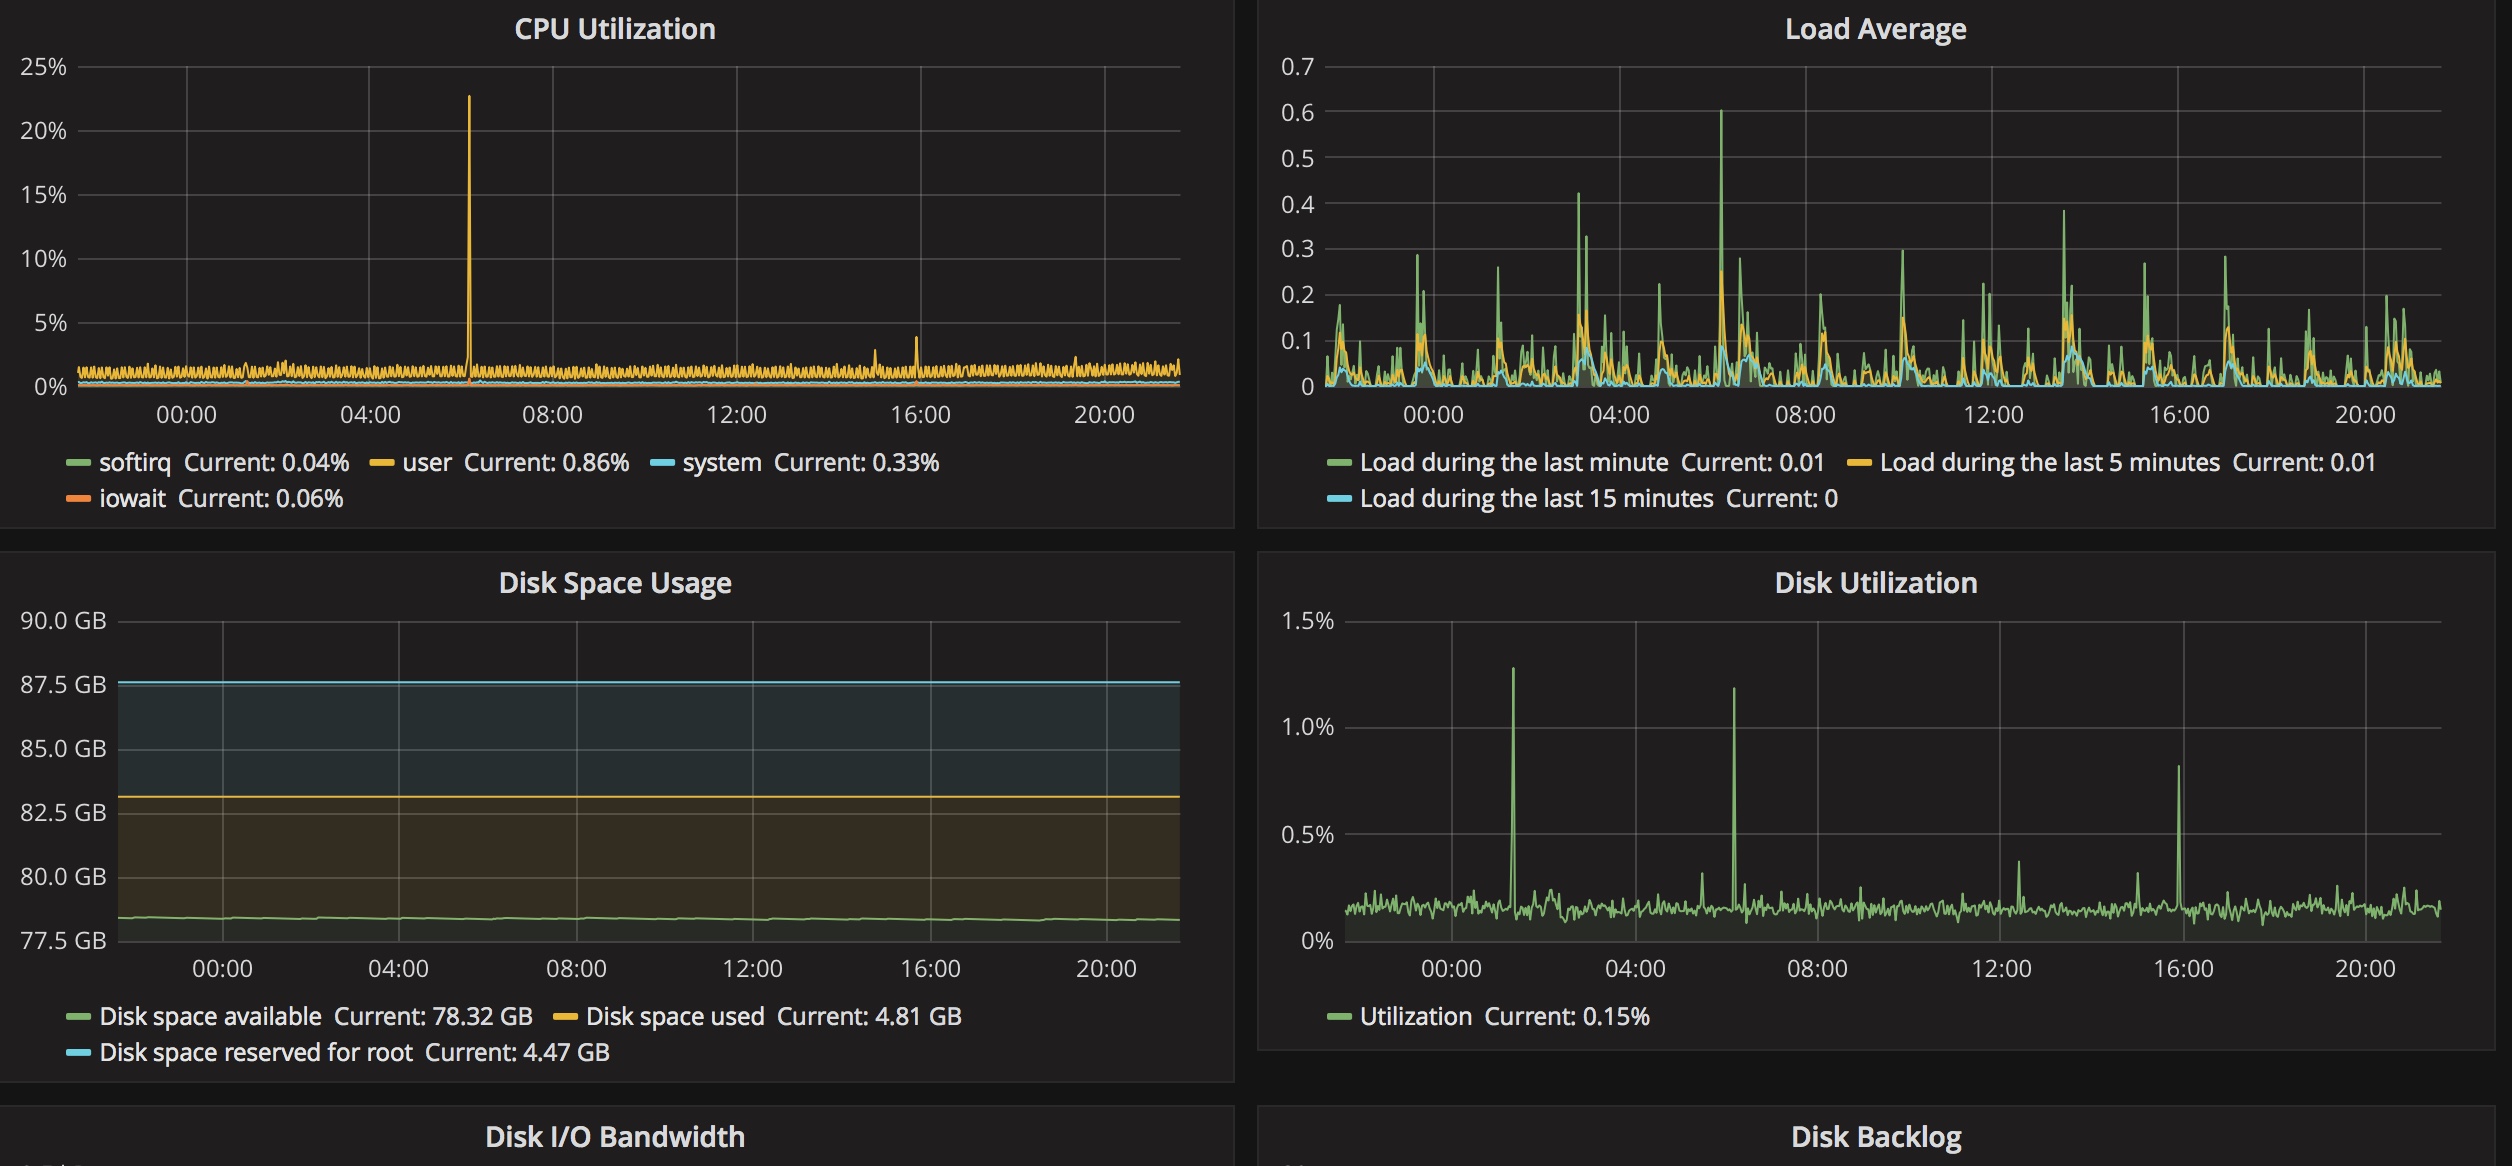
Dashboard for Linux server monitored by netdata-master
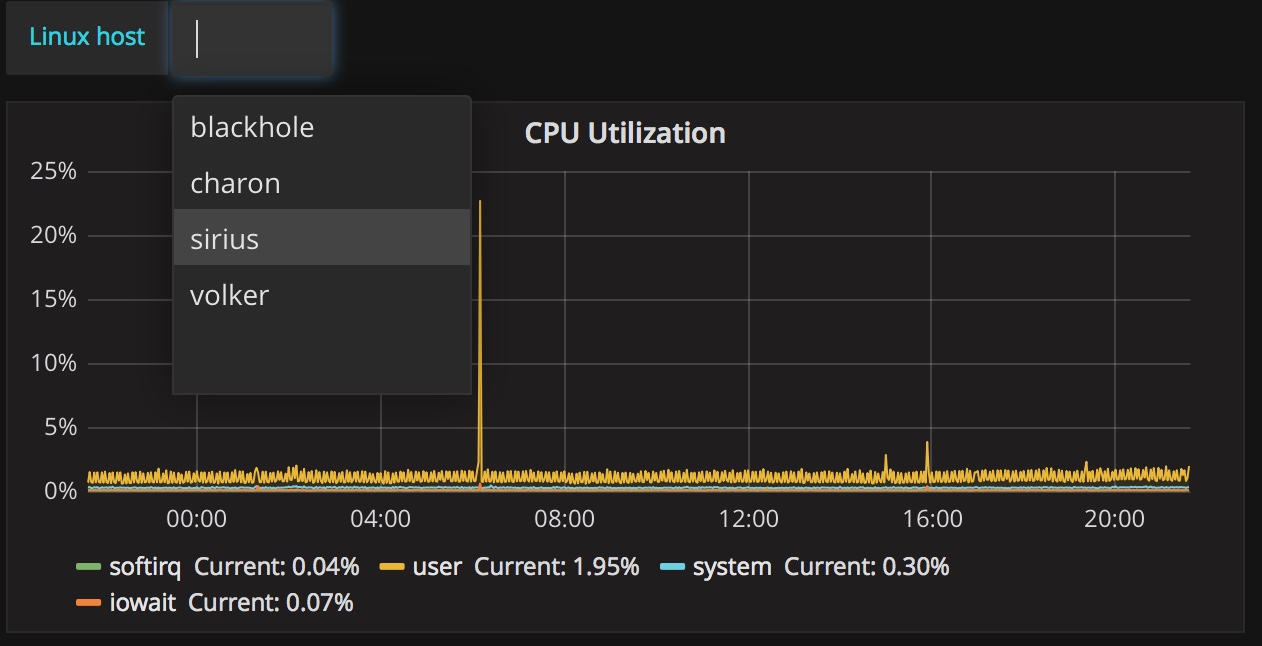
Since netdata 1.6 you can archive data from a master-host to a time series db. This dashboard contains a template for all hosts reported by the netdata master.
1.) Set this in /etc/netdata/netdata.conf:
[backend]
enabled = yes
type = opentsdb
destination = localhost
2.) Set this in /etc/influxdb/influxdb.conf:
[[opentsdb]]
enabled = true
3.) Create a data source in Grafana pointing at the opentsdb database in your influxdb
4.) Upload this dashboard to your Grafana installation
5.) Enjoy the view
Based on netdata-host dashboard from grafanauser.
Data source config
Collector config:
Upload an updated version of an exported dashboard.json file from Grafana
| Revision | Description | Created | |
|---|---|---|---|
| Download |


