
Mikrotik Loki Logs
Mikrotik Loki Logs
![]()
![]()
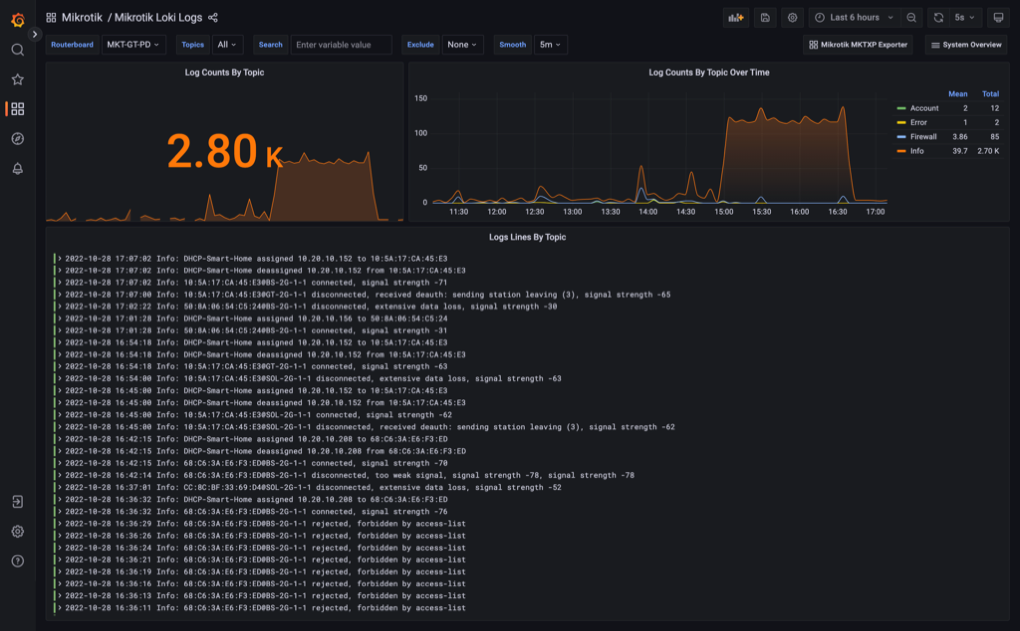
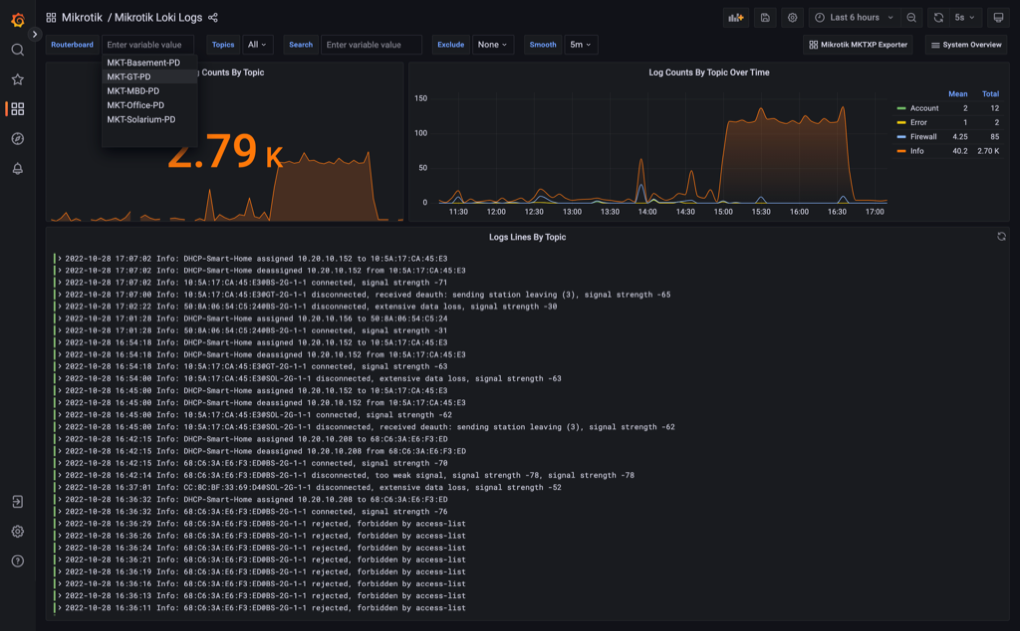
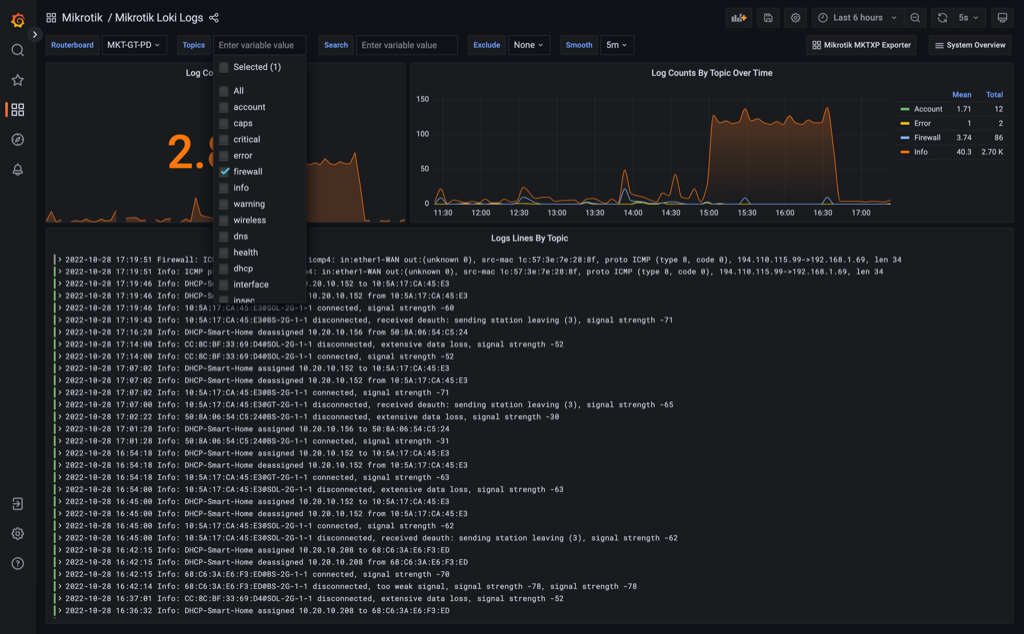
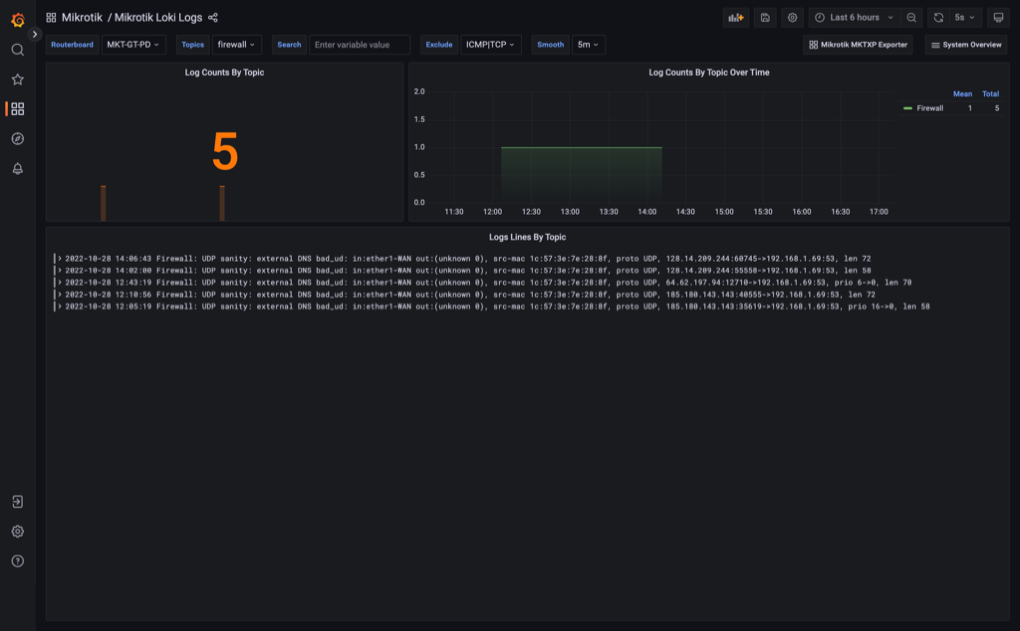
This dashboard is a part of MKTXP-Stack, a dockerized syslog-ng / promtail / Loki stack to receive & process logs from multiple Mikrotik RouterOS devices in a centralized location
Data source config
Collector type:
Collector plugins:
Collector config:
Revisions
Upload an updated version of an exported dashboard.json file from Grafana
| Revision | Description | Created | |
|---|---|---|---|
| Download |
Grafana Loki (self-hosted)
Easily monitor Grafana Loki (self-hosted), a horizontally scalable, highly available, multi-tenant log aggregation system inspired by Prometheus, with Grafana Cloud's out-of-the-box monitoring solution.
Learn more