Octopus Energy
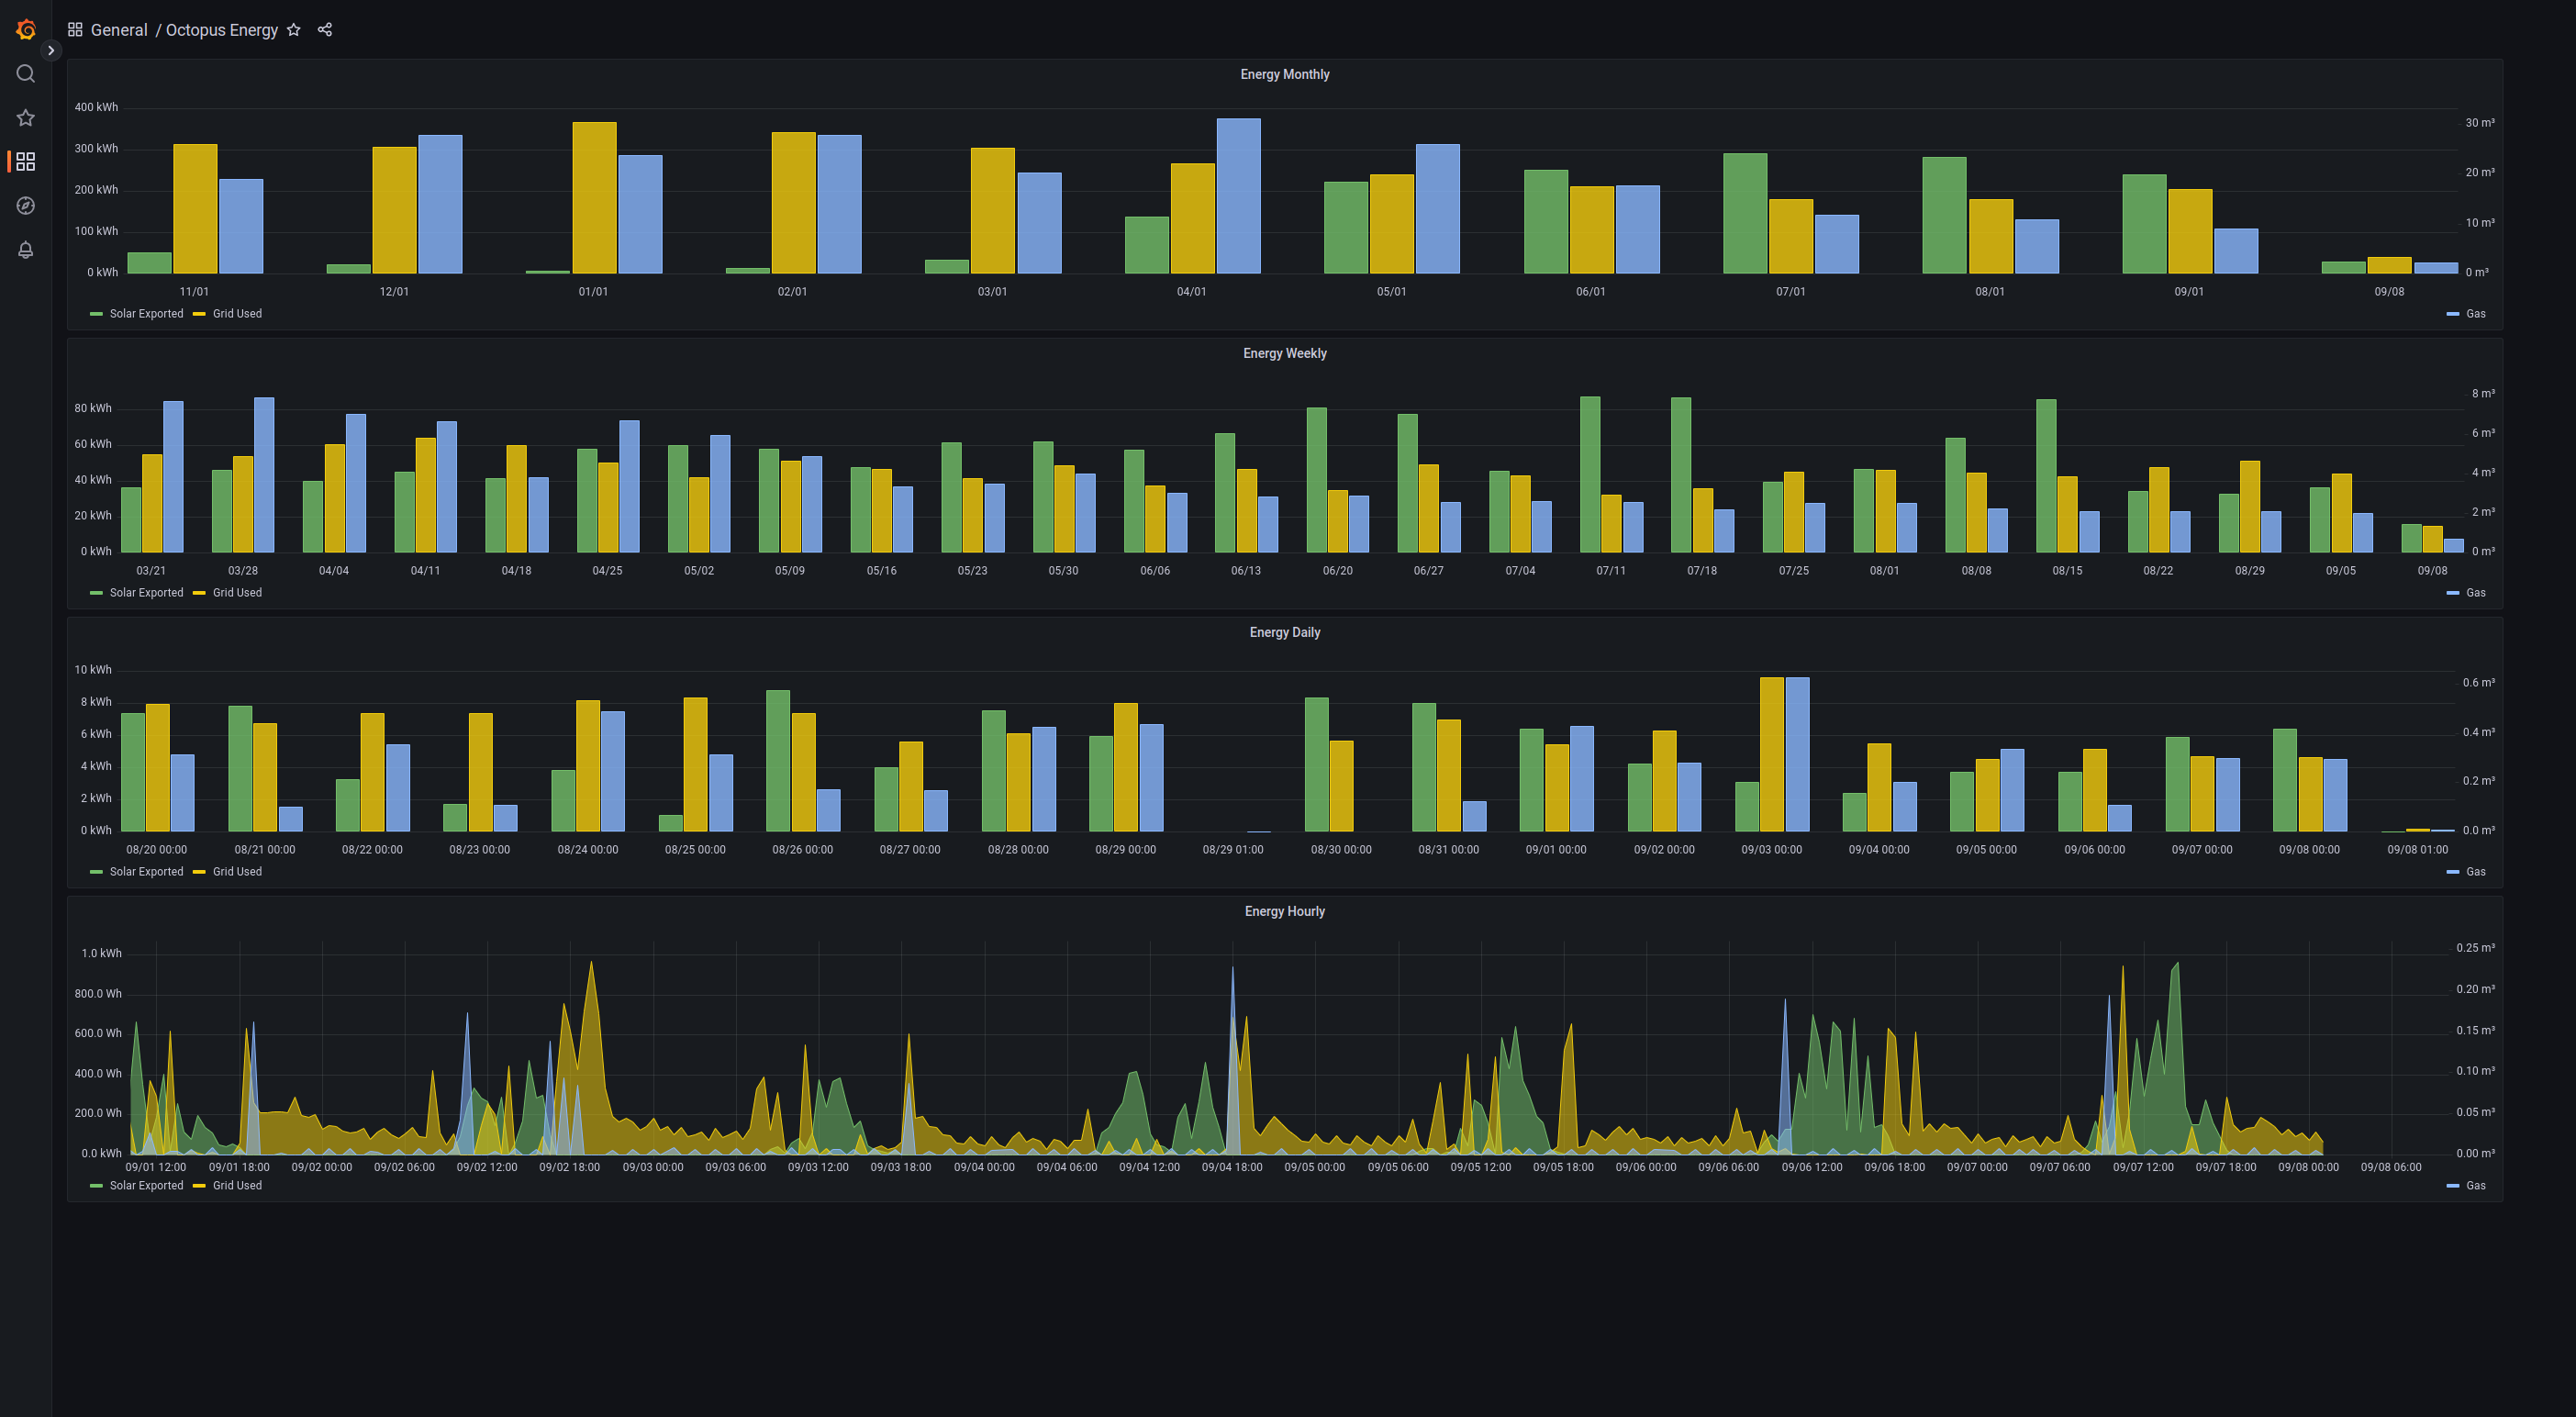
Electricity and gas consumption using Octopus Energy API (https://developer.octopus.energy/docs/api/). Including support for Solar Panel feed-in.
Setting up a Grafana dashboard to monitor energy consumption from Octopus Energy in the UK.
Full documentation on https://www.baldy.za.net/blog/grafana-octopus-energy-api
Using the Octopus Energy APIs. Includes gas, electricity and solar panel feed-in.
Install Octopus Energy API Grafana Dashboard
Grafana Datasource
- Login to your Octopus Energy Account https://octopus.energy/dashboard/developer/ and make note of your API Key
- In your Grafana instance, install the Infinity Datasource Plugin. (https://grafana.com/grafana/plugins/yesoreyeram-infinity-datasource/)
- Add a datasource, Infinity. The only settings you need for the Infinity Datasource are Auth Type = "Basic Authentication" and Username = SK_XXXX (your API Key from https://octopus.energy/dashboard/developer/ )
Import Dashboard
- Dashboards -> Import
- Import via grafana.com =** https://grafana.com/grafana/dashboards/16887-octopus-energy/** -> Load
- Select the Infinity Datasource that your created with your API Key
- Fill in the required variables
MPAN
Open https://octopus.energy/dashboard/, scroll down to your address with your meters below it. If you have solar panels, you will have two electricity meters. Determine which one is the incoming, the MPAN number is top right of the box "This is your MPAN, a unique identifier for your meter".
elec_serial
Openhttps://octopus.energy/dashboard/, scroll down to your address and meters, find your Electricity "Serial number:". If you have solar panels make sure this is the incoming supply.
gas_serial
Open https://octopus.energy/dashboard/, scroll down to your address and meters, find your Gas "Serial number:"
MPRN
Open https://octopus.energy/dashboard/developer/, "Your gas meter-point’s MPRN is:"
solar_MPAN
Open https://octopus.energy/dashboard/, scroll down to your address, just below determine which electricity meter is your solar, the MPAN is top right This is your MPAN, a unique identifier for your meter ".
Data source config
Collector config:
Upload an updated version of an exported dashboard.json file from Grafana
| Revision | Description | Created | |
|---|---|---|---|
| Download |

