PV Power Ahoy
AHOY-DTU (https://github.com/grindylow/ahoy) delivers power metrics from inverter via MQTT to a MQTT (mosquitto) server. Telegraf subscribes that topic (“inverter/#”) and writes everything to InfluxDB. The Dashboard consumes data from InfluxDB.
Note: This dashboard will maintained here: https://github.com/c1328/ahoy-mosquitto-telegraf-influx-grafana and the successor that is based on a ioBroker solution (and an alternative for influxdb 2.x) can be found here: https://github.com/c1328/ahoy-iobroker-influx-grafana
Summary: AHOY-DTU (https://github.com/grindylow/ahoy) delivers power metrics from inverter via MQTT to a MQTT (mosquitto) server. Telegraf subscribes that topic ("inverter/#") and writes everything to InfluxDB. The Dashboard consumes data from InfluxDB.
Architecture: Inverter -> Ahoy-DTU (ESP8266) -> MQTT (mosquitto) -> Telegraf -> InfluxDB -> Grafana
Warning: The connection Ahoy-DTU (ESP8266) -> MQTT (mosquitto) is currently insecure (no SSL possible).
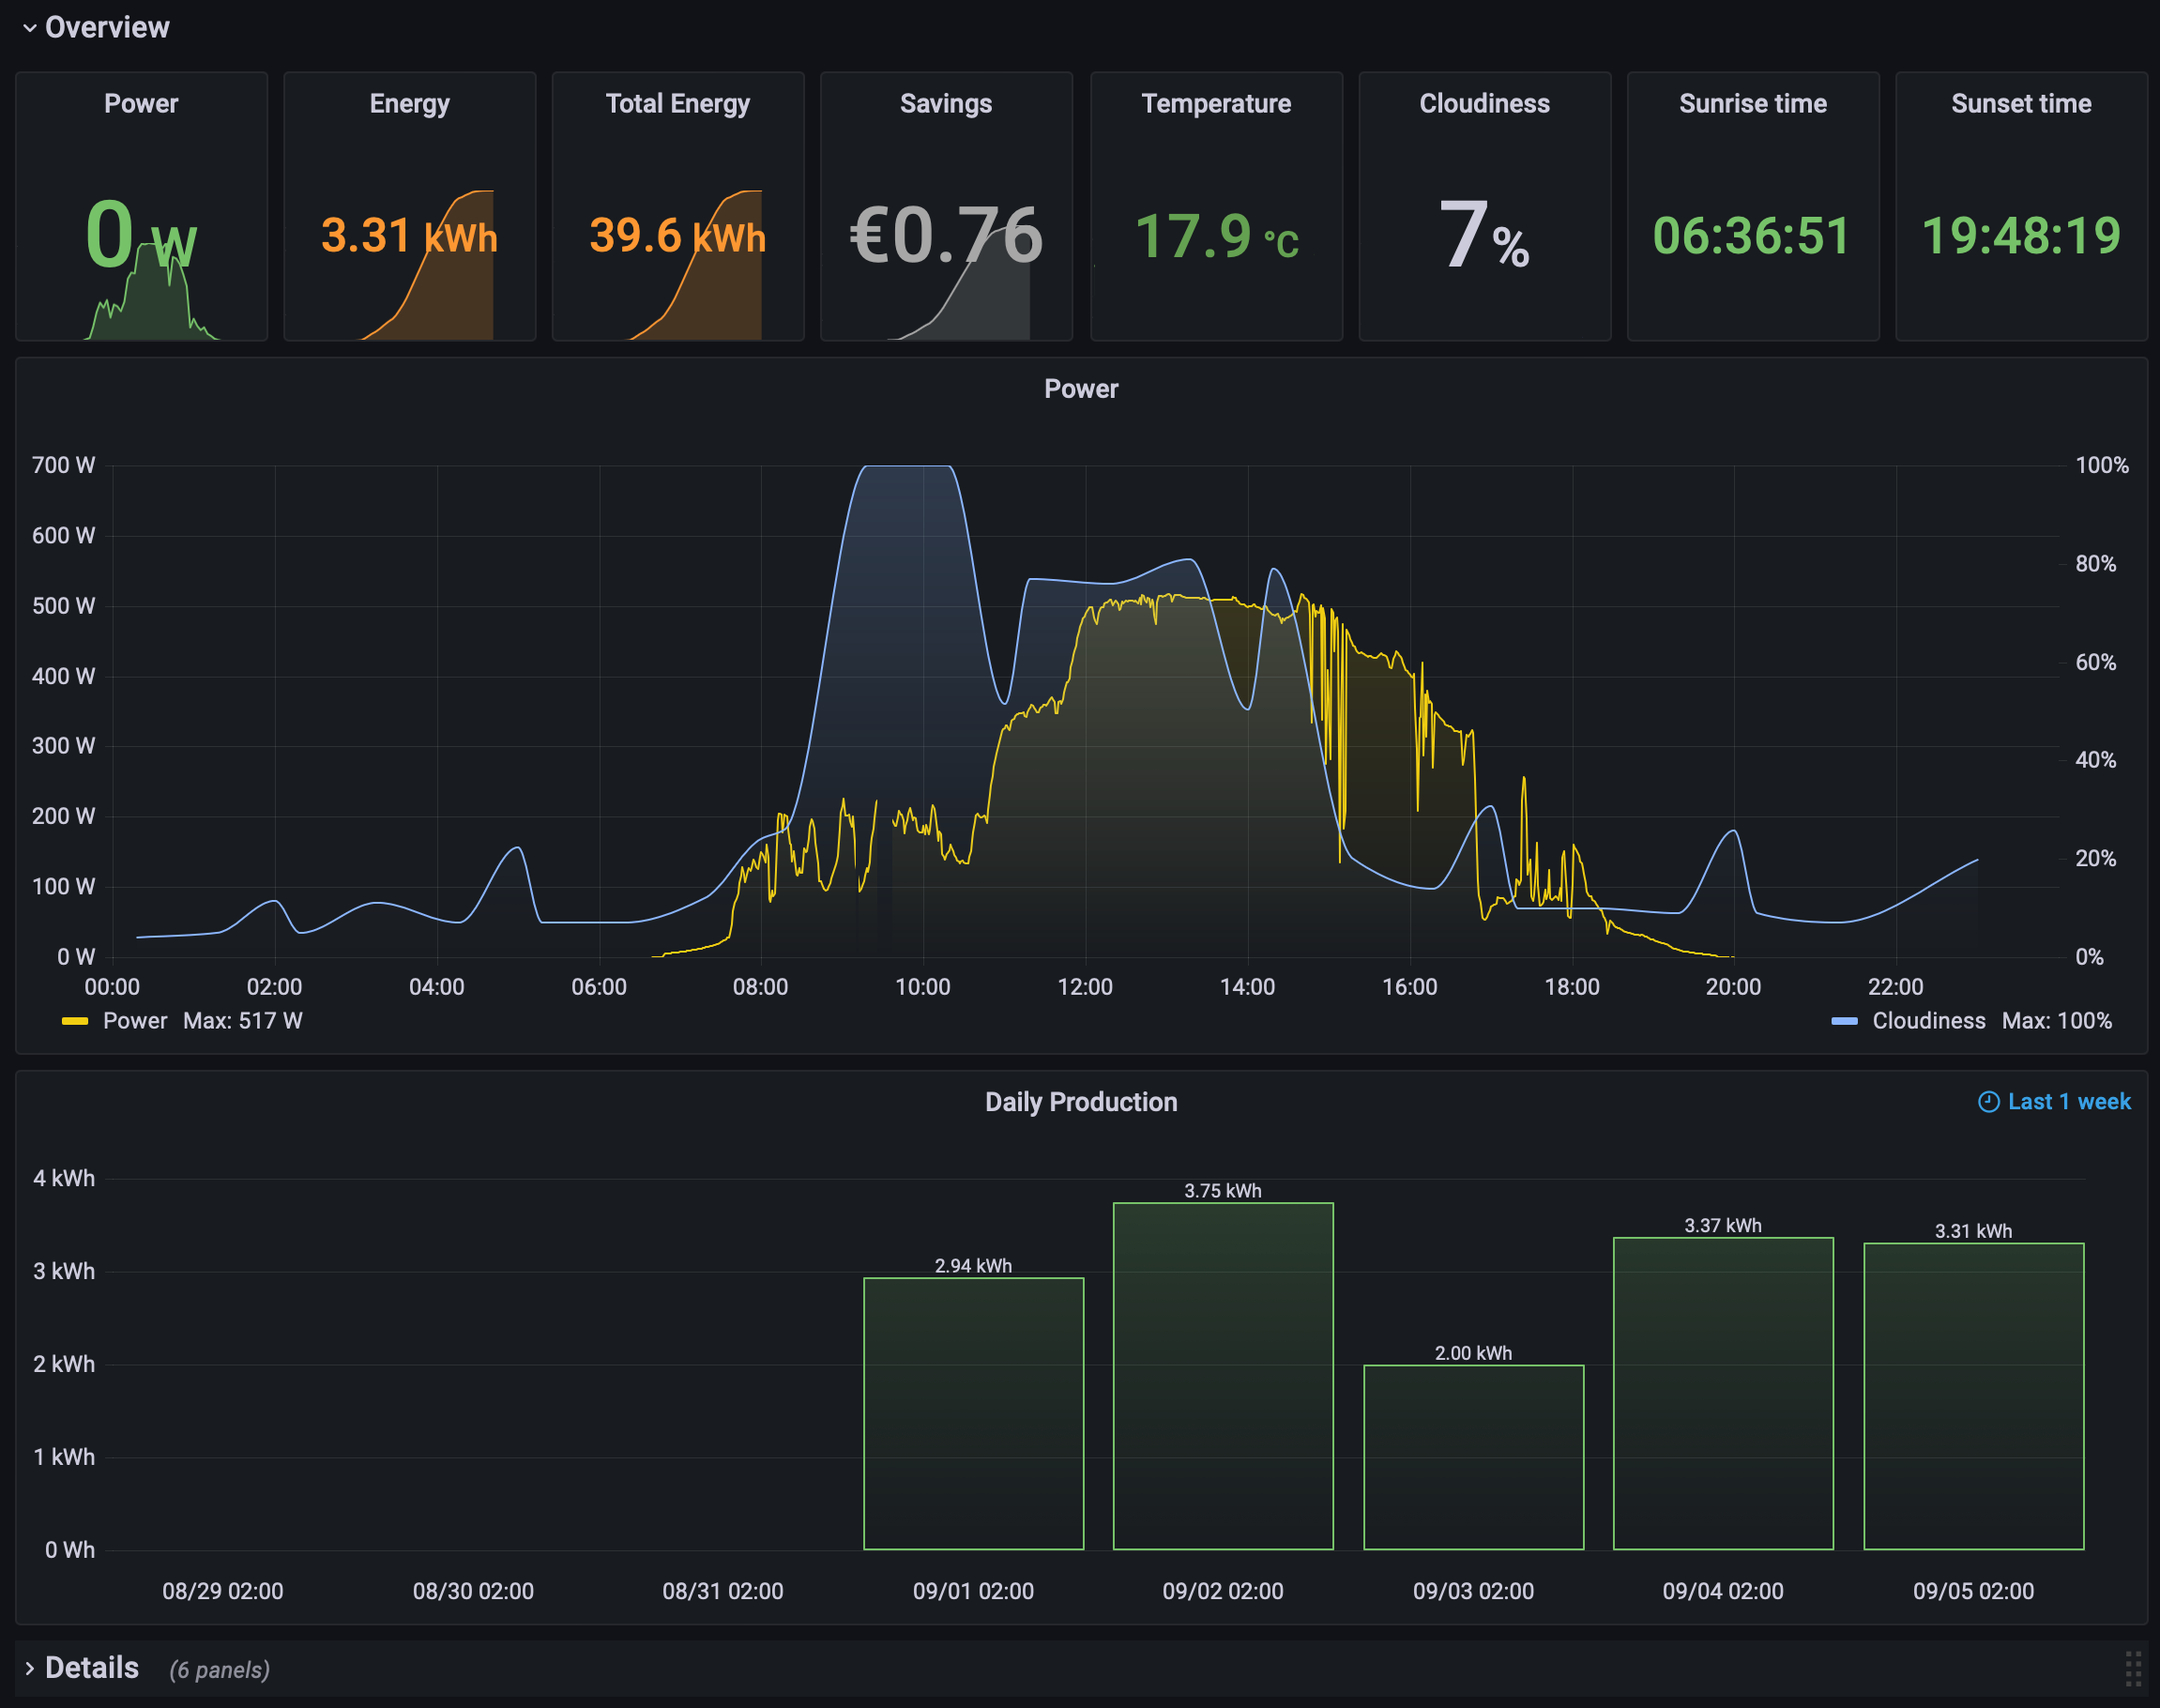
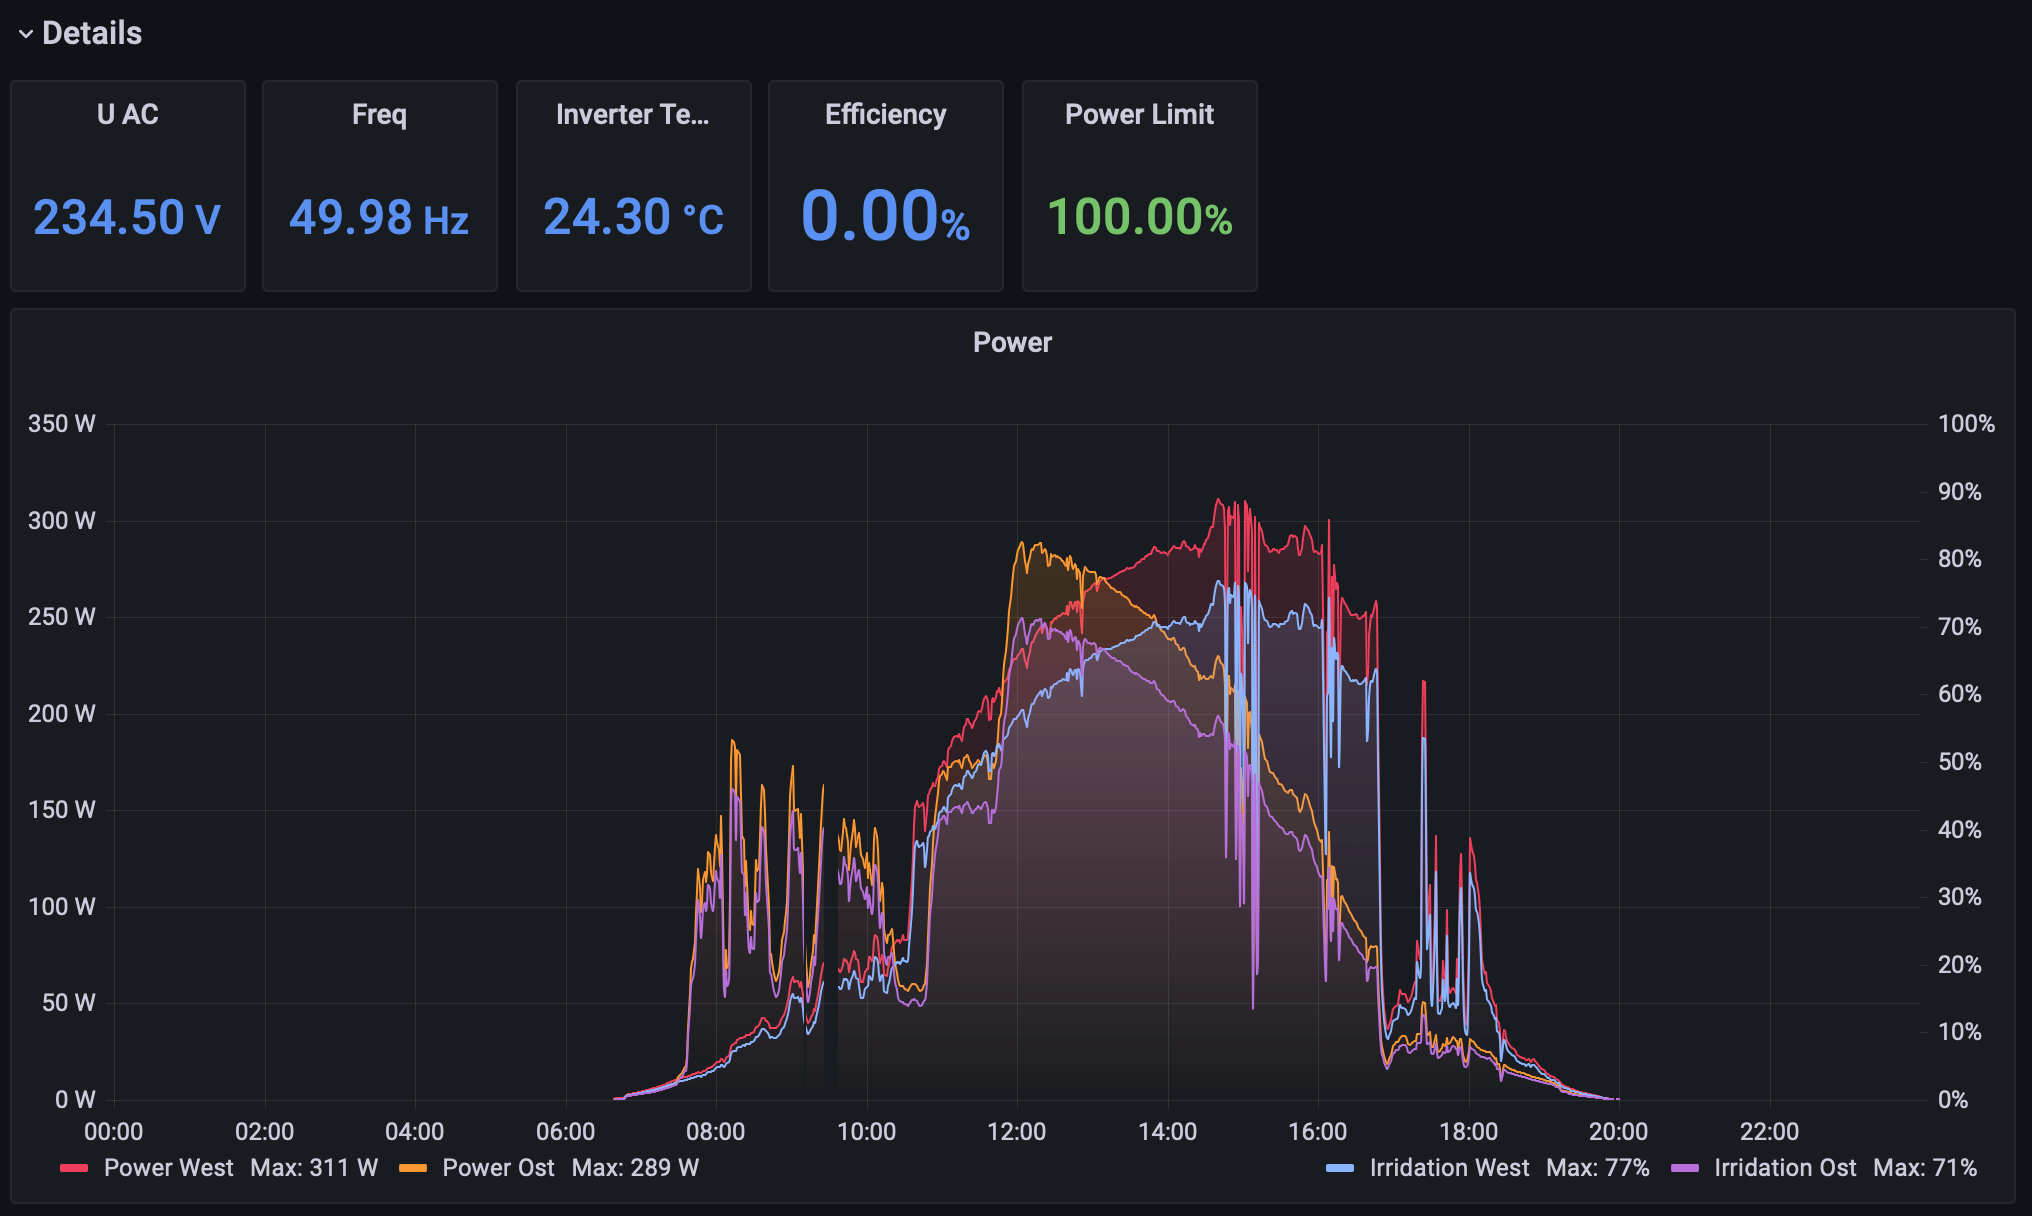
Dashboard content: Two sections, an overview and a detail area with all metrics that might be interesting for you.
Prerequisites:
- Ahoy-DTU with configured MQTT server (topic and name of inverter will be configured in dashboard as variable)
- MQTT server (listening on port 1883; SSL is not supported by AHOY-DTU yet)
- Telegraf (connected to an InluxDB, consumer configured as given below)
- InfluxDB (connected/consumable by your Grafana installation)
Installation:
- Configure Ahoy DTU to send MQTT messages to your MQTT Server
- Check if you receive MQTT messages "mosquitto_sub -h localhost -t ahoyTopic/# -u "USER" -P "PASSWORD" -v"
- Results looks like:
- ahoyTopic/ahoyInvertername/ch1/U_DC 34.500
- ahoyTopic/ahoyInvertername/ch1/I_DC 0.890
- ahoyTopic/ahoyInvertername/ch1/P_DC 30.800
- (...)
- With setting up mqtt_consumer in your Telegraf config you should see a table "mqtt_consumer" in your Telegraf database at InfluxDB
- Import Grafana Dashboard via JSON or ID
- Enjoy dashboard and producing energy (dashboard is configured for one inverter and two panels east/west - please adjust to your needs)
Dashboard variables:
- kwhPrice: Define your individual price of a kWh to calculate your potential daily savings - in case you consumed all of your produced energy.
- ahoyTopic: the name of your topic configured at Ahoy-DTU
- ahoyInvertername: the name of your inverter configured at Ahoy-DTU
- Country And City: see "Optional" below
Telegraf configs for mqtt and openweathermap:
[[inputs.mqtt_consumer]]
- servers = ["tcp://localhost:1883"]
- topics = [ "ahoyTopic/#" ]
- qos = 0
- connection_timeout = "30s"
- username = "USERNAME"
- password = "PASSWORD"
- data_format = "value"
- data_type = "float"
[[inputs.openweathermap]]
- app_id = "YOUR_API_KEY"
- city_id = ["CITY1", "CITY2", "CITY3"]
- fetch = ["weather", "forecast"]
- interval = "10m"
Optional: I added some weather metrics to the dashboard (e.g. cloudiness of the region my PV/inverter is located). Please check https://grafana.com/grafana/dashboards/9710-open-weather-map/ to understand how to get weather metrics via Telegraf to your InfluxDB. I set the parameter to fetch = ["weather", "forecast"] to get some cloudiness forecast as well, that's why there are two variables (Country and City) to specify your location to get the right one in case you collect weather metrics for more than a single location.
Feel free to feedback!
Data source config
Collector config:
Upload an updated version of an exported dashboard.json file from Grafana
| Revision | Description | Created | |
|---|---|---|---|
| Download |

