java tron server
Monitor your java-tron server with Prometheus and Grafana.
Java Tron Server Dashboard
Monitor your Java Tron server and view detailed information on the current status of the blockchain. This Grafana Dashboard requires you to have a running instance of prometheus and java-tron fullNode which open metric.
prometheus config
global:
  scrape_interval: 30s
  scrape_timeout: 10s
  evaluation_interval: 30s
scrape_configs:
- job_name: java-tron
  scrape_interval: 3s
  scrape_timeout: 2s
  metrics_path: /metrics
  static_configs:
  - targets:
    - 127.0.0.1:9527
    labels:
      group: group-main
      instance: instance-01
  - targets:
    - 172.0.0.12:9528
    labels:
      group: group-test
      instance: instance-02
Features
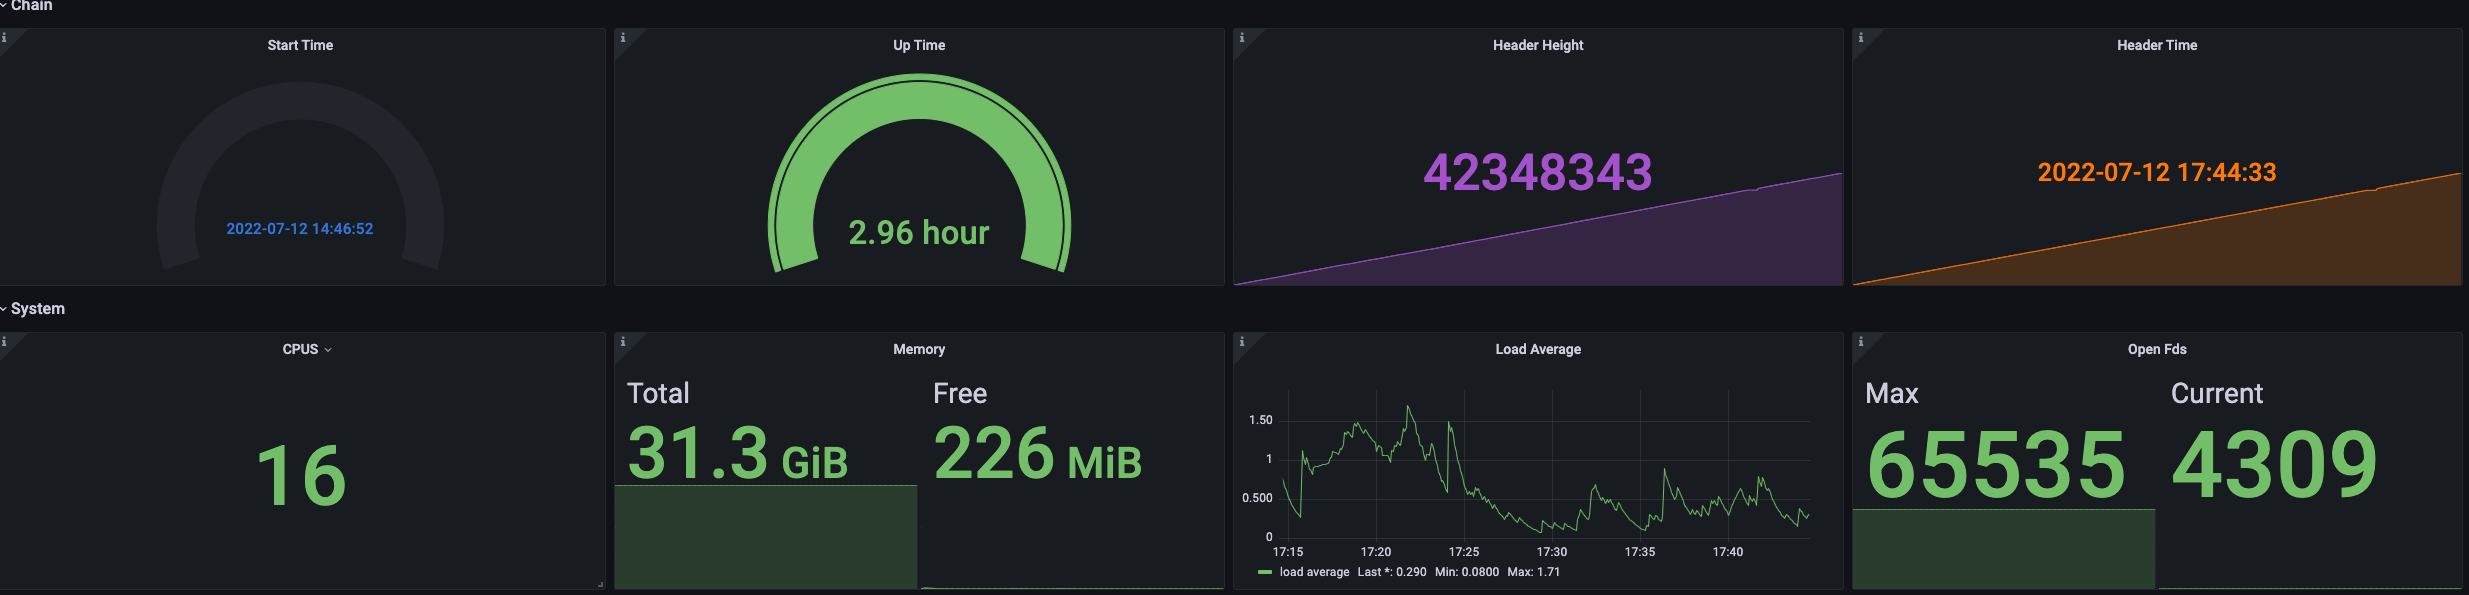
- Blockchain current status.
- Node system status .
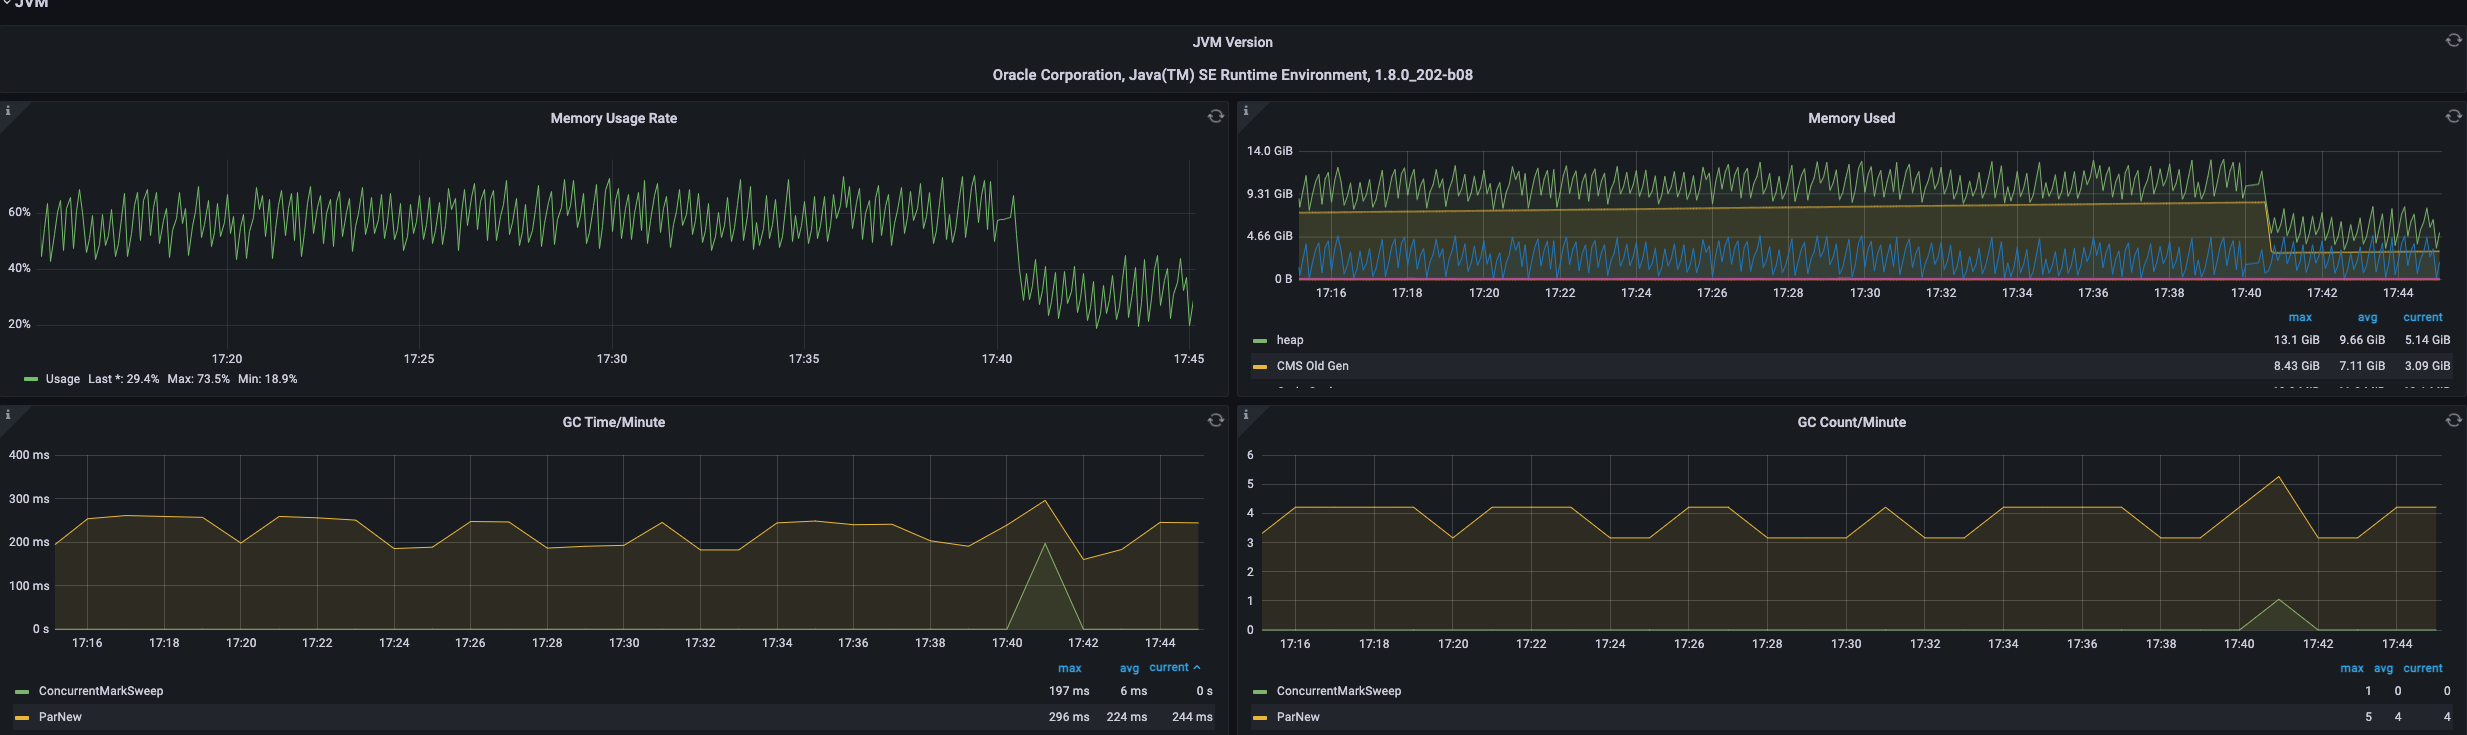
- JVM status.
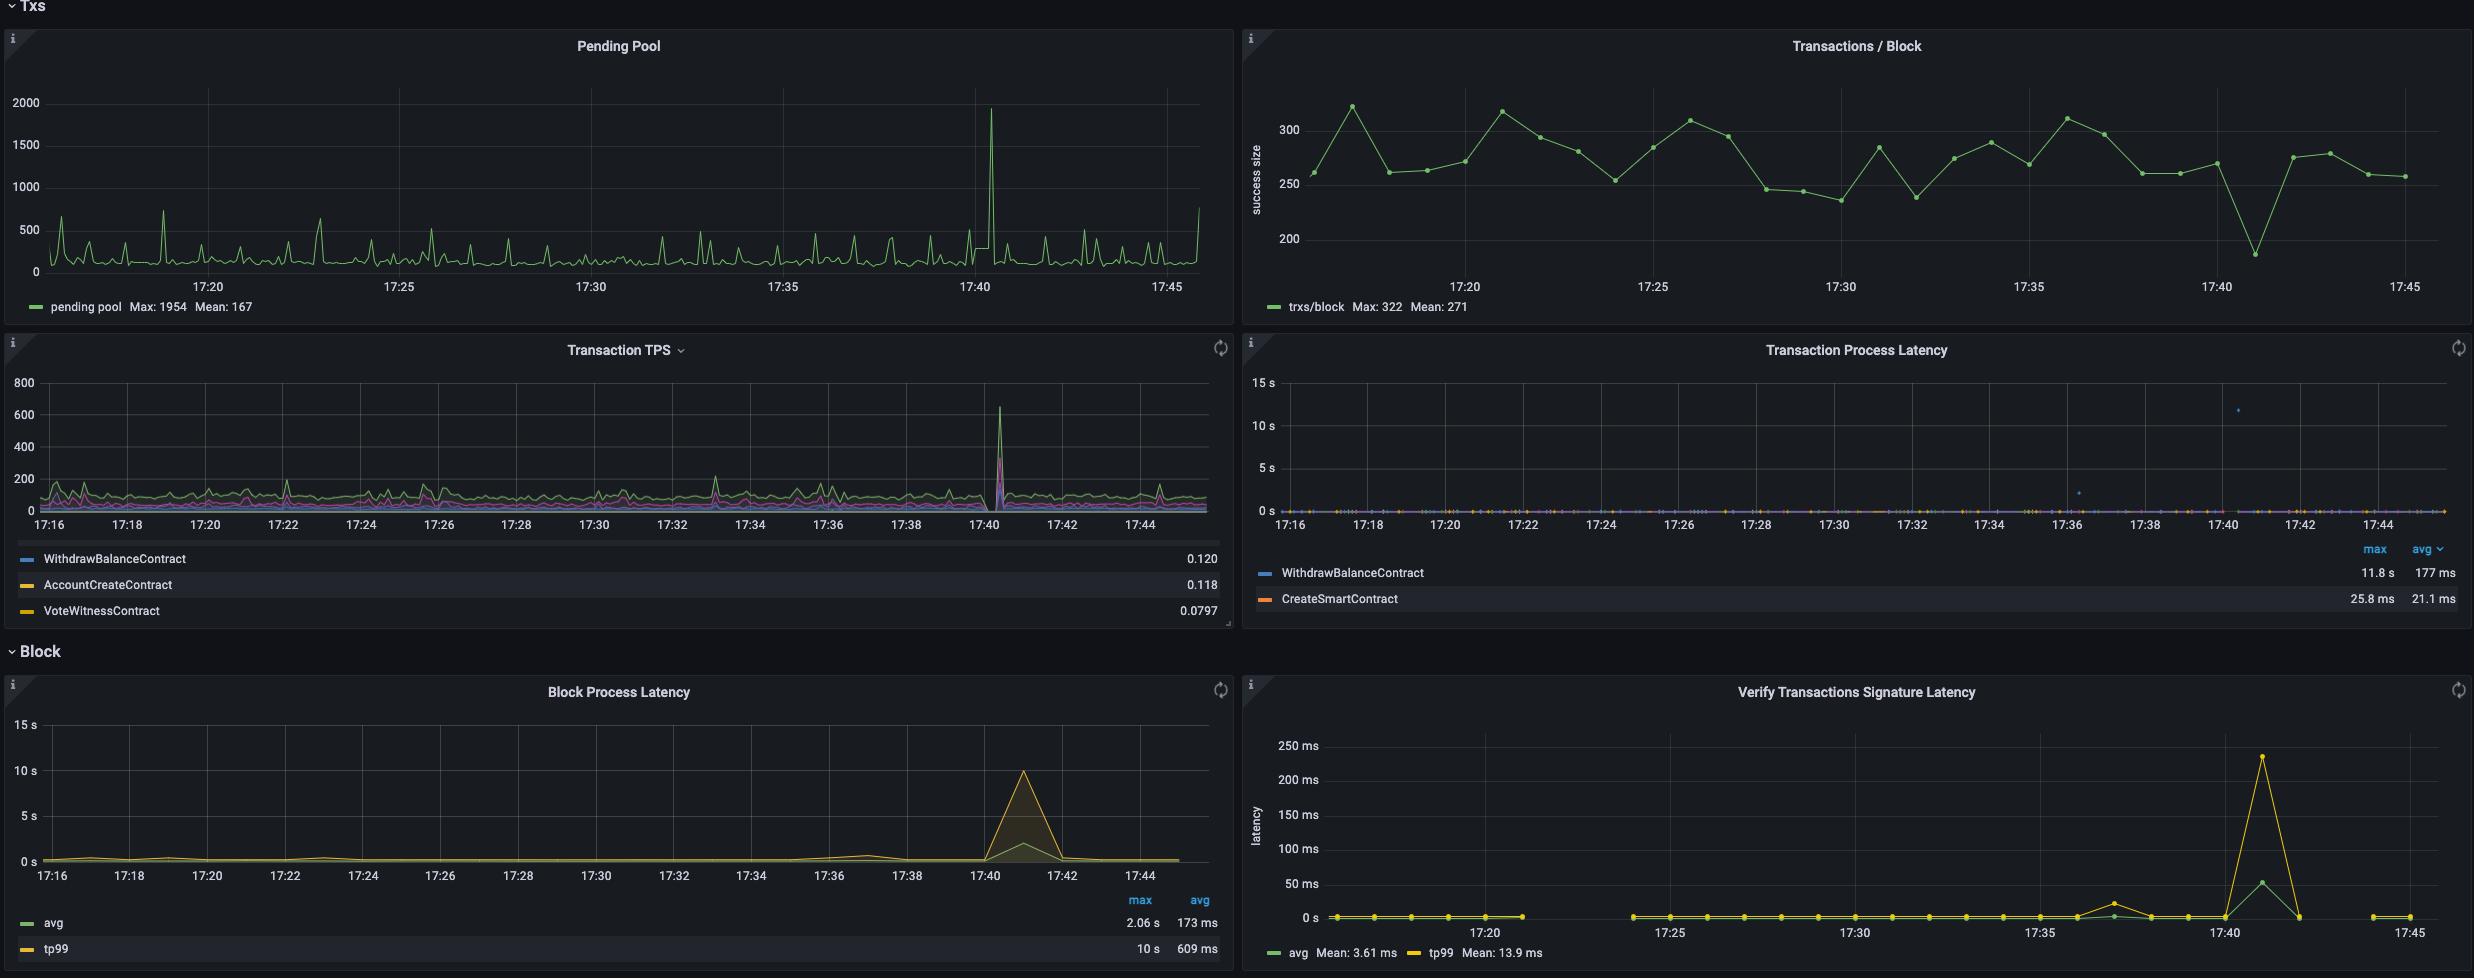
- Block and transaction status.
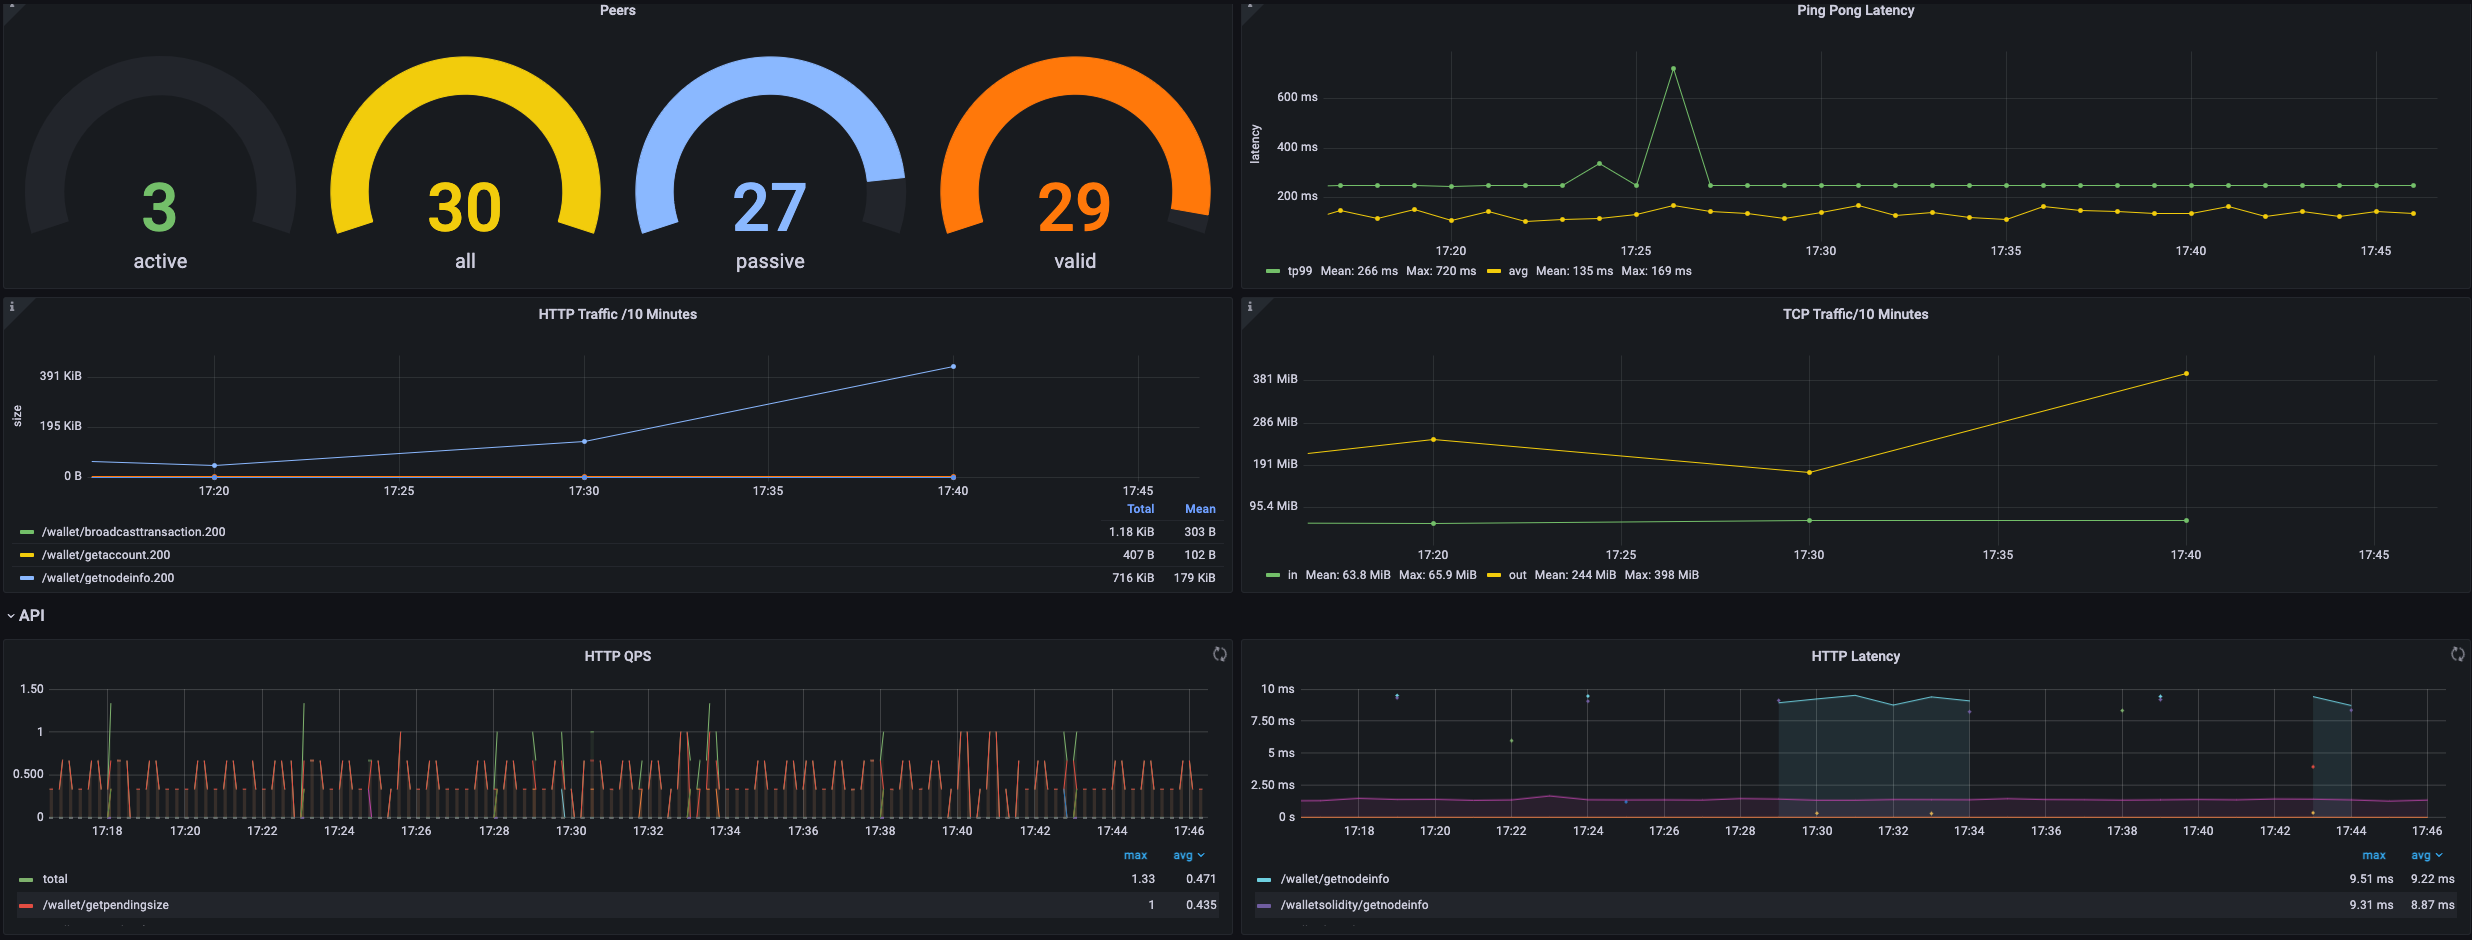
- Net Peer status.
- API info.
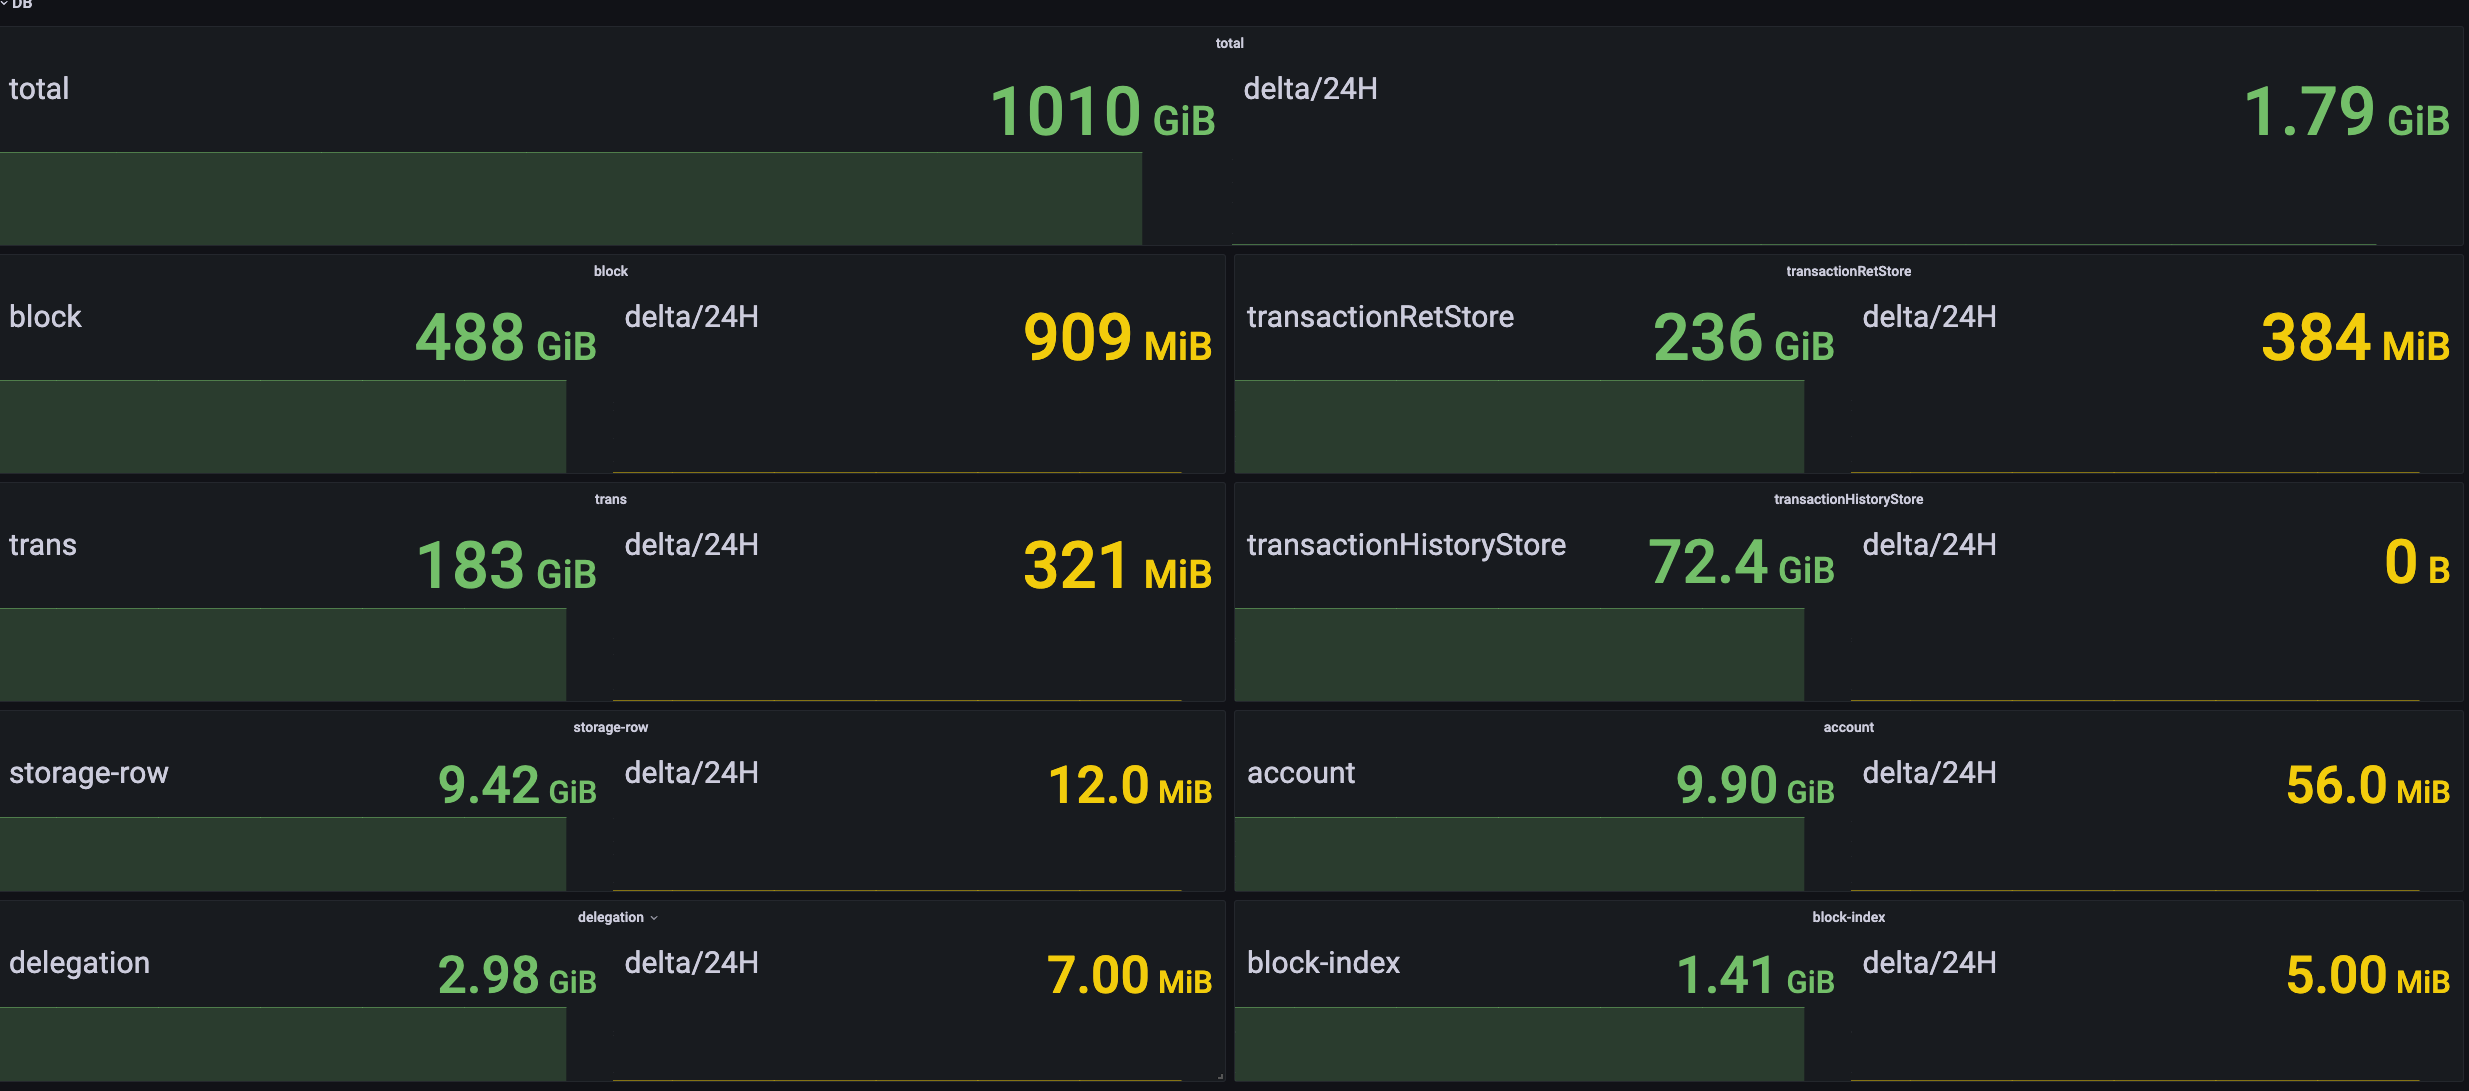
- DB info.
Data source config
Collector type:
Collector plugins:
Collector config:
Revisions
Upload an updated version of an exported dashboard.json file from Grafana
| Revision | Description | Created | |
|---|---|---|---|
| Download |
Java Virtual Machine (JVM)
Easily monitor a Java virtual machine, which allows computers to run Java programs, with Grafana Cloud's out-of-the-box monitoring solution.
Learn more