
Umbrel Server Metrics
Monitor your Umbrel server's temperature, storage, and memory metrics using Grafana.
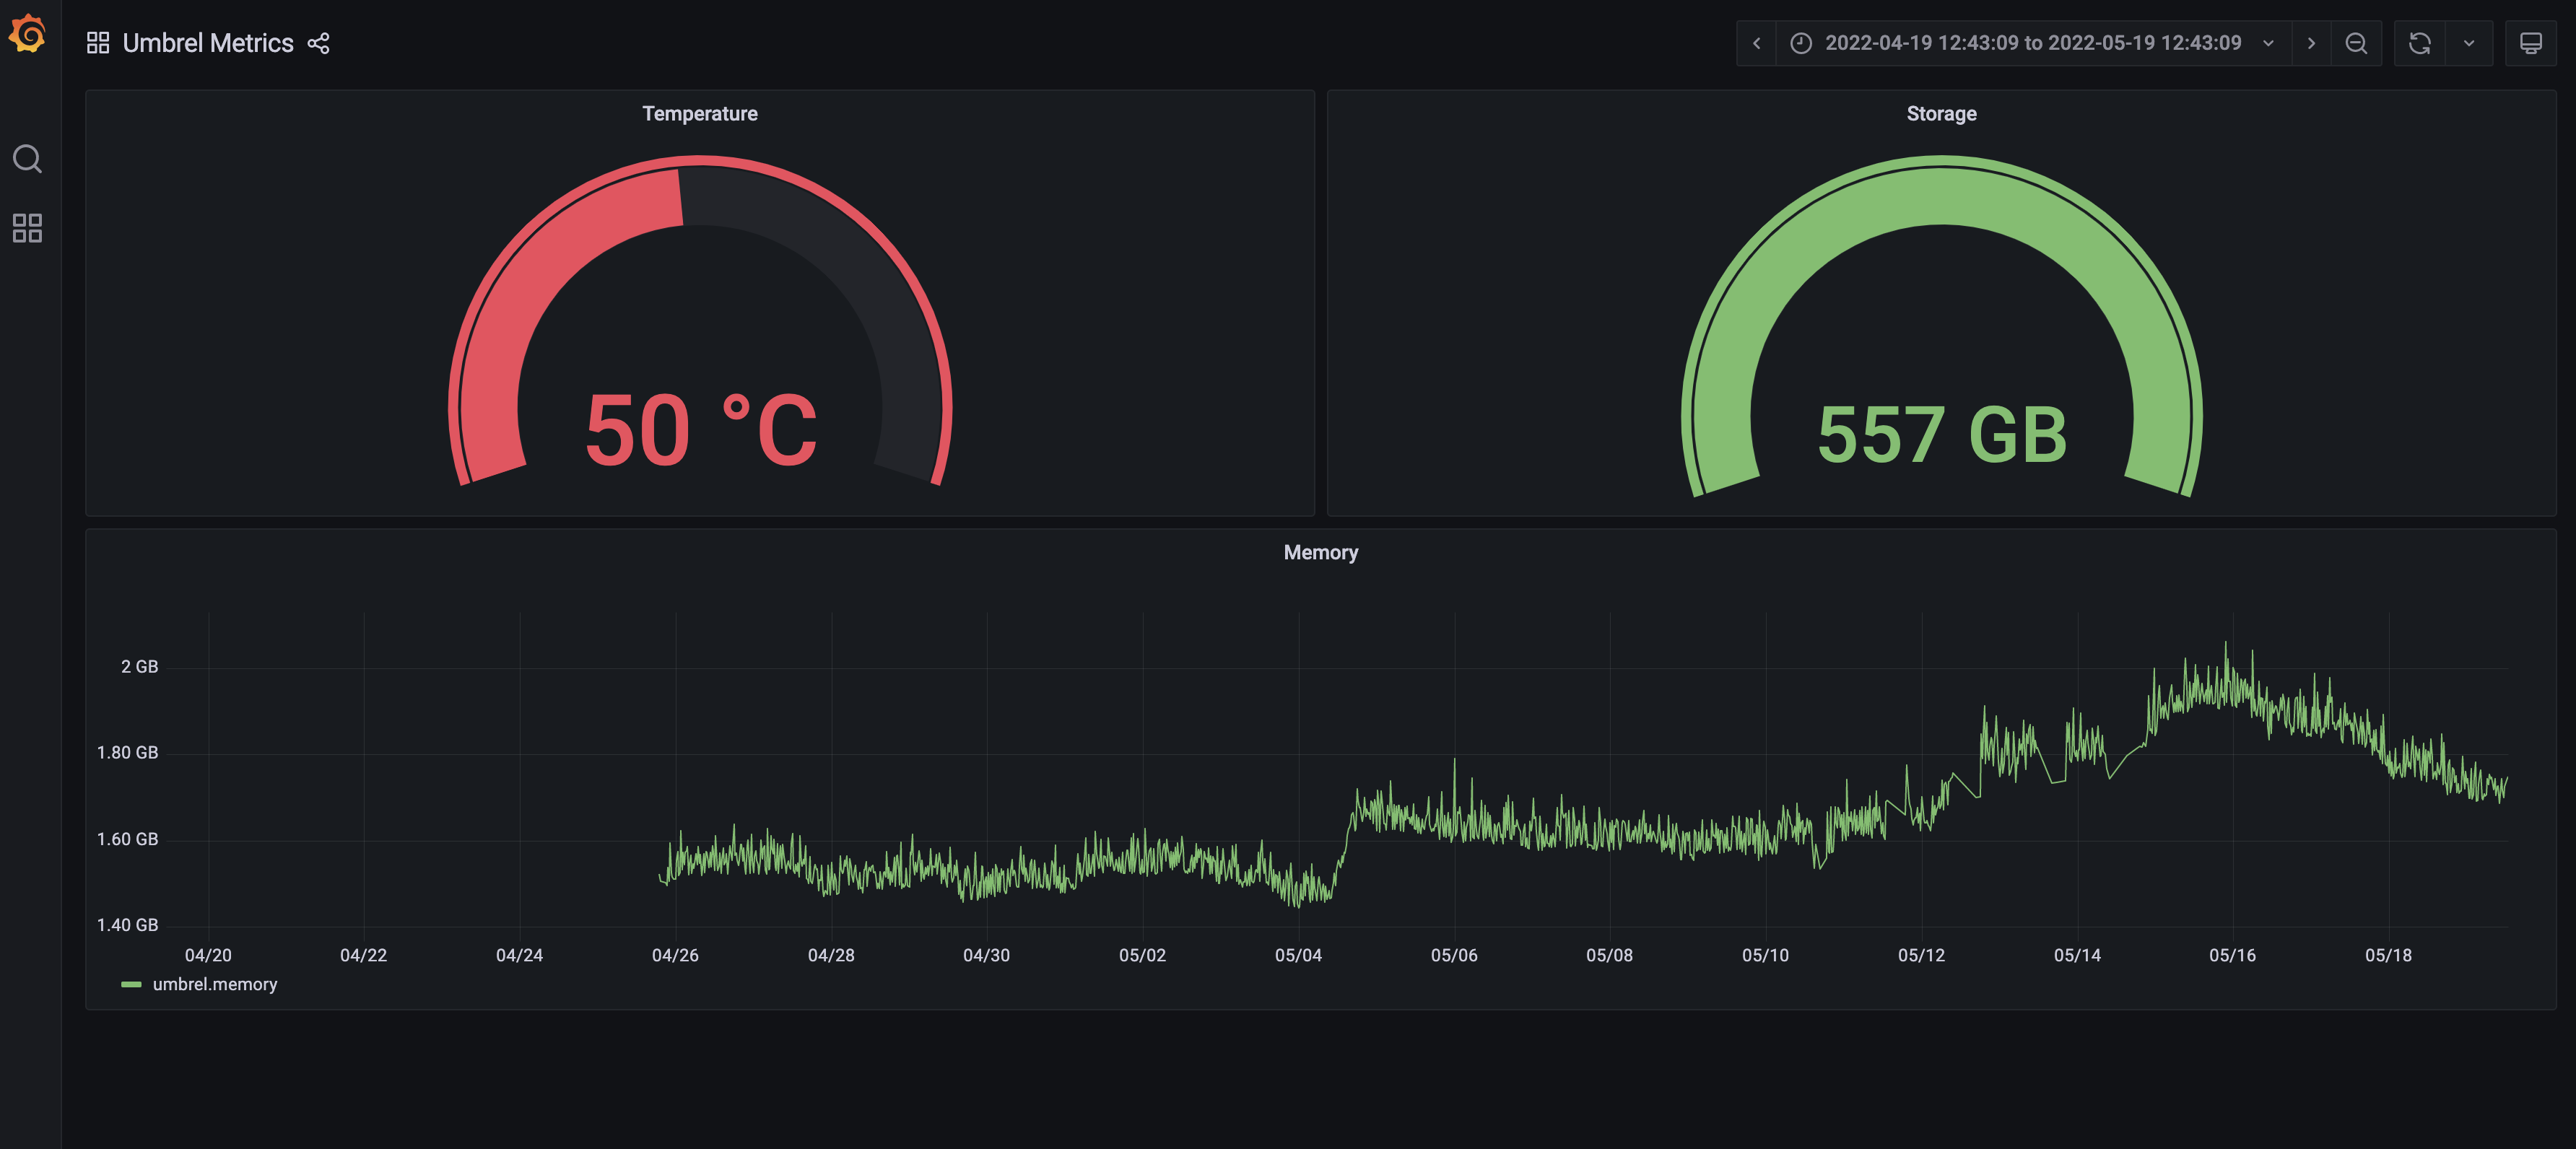
Use this dashboard to monitor the temperature, storage, and memory metrics from your Umbrel server so that the software running on your server, such as a Bitcoin node, stay reliable and always-online. The metrics from this dashboard will inform you when it is necessary to upgrade your disk space, memory, or cooling equipment as required.
Data source config
Collector type:
Collector plugins:
Collector config:
Revisions
Upload an updated version of an exported dashboard.json file from Grafana
| Revision | Description | Created | |
|---|---|---|---|
| Download |