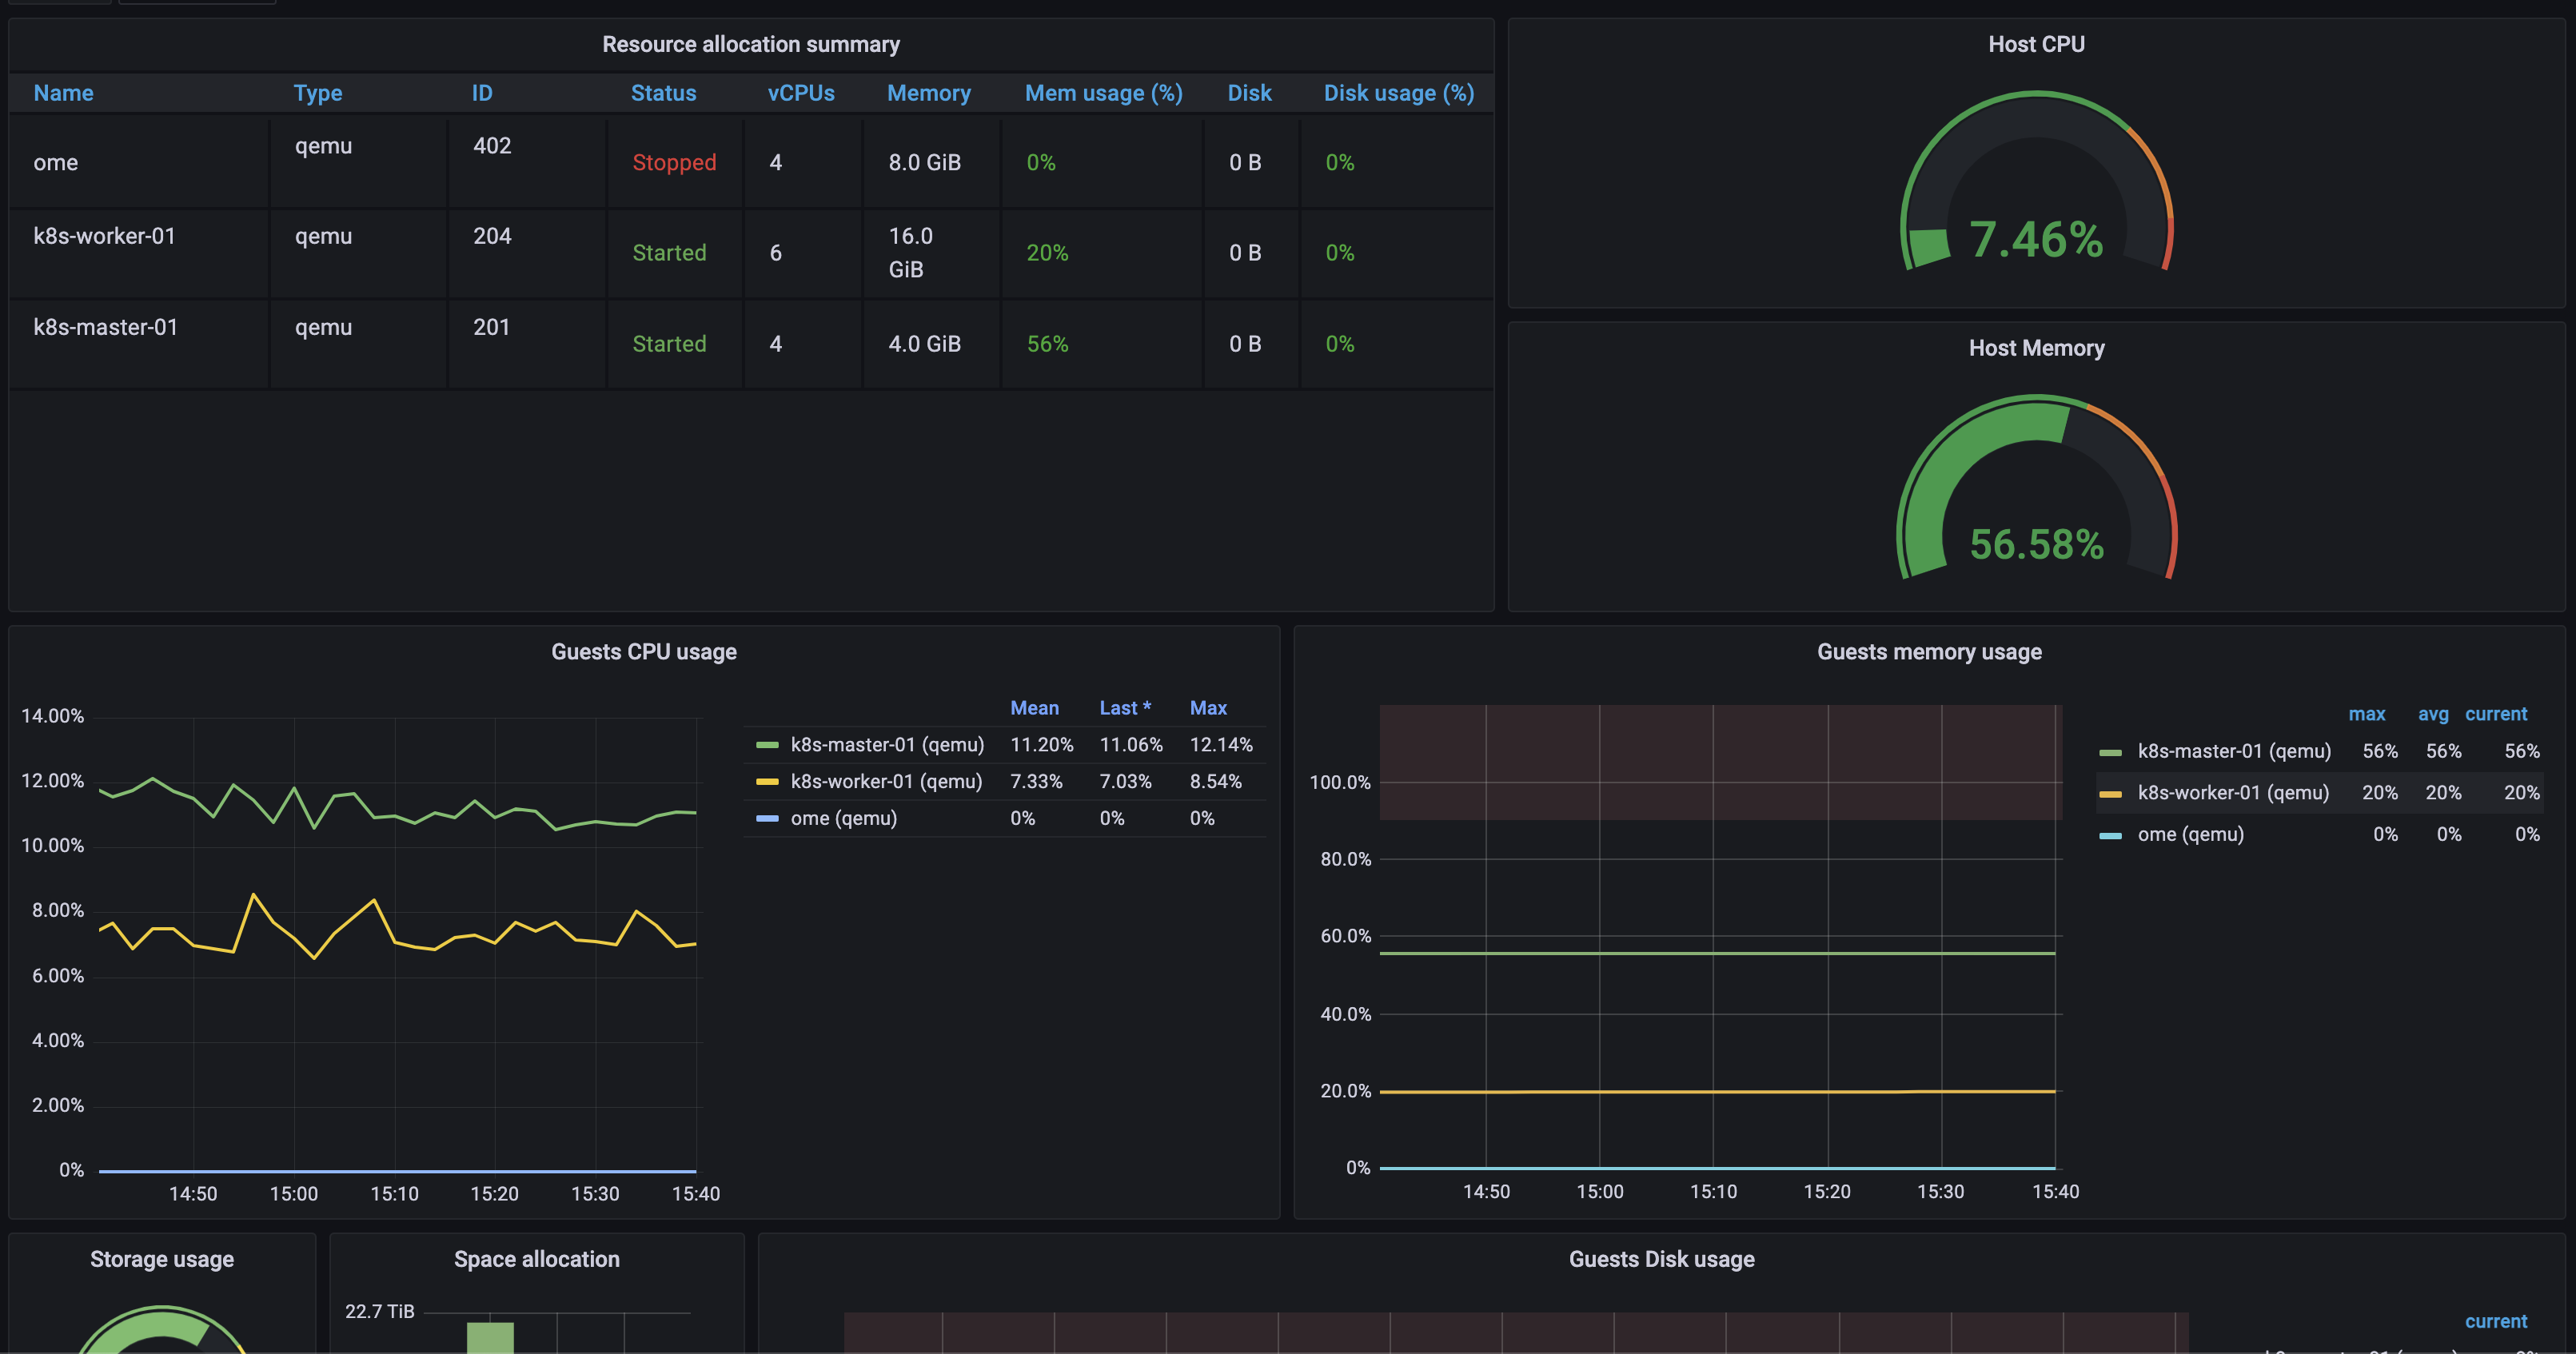
Proxmox metric-server via Prometheus
Proxmox Virtual Environment Dashboard from metric-server trough influxdb-exporter
Kubernetes - prometheus setup for proxmox metric server
Export metrics from proxmox's integrated metric server in influxdb format, convert them in prometheus format, and collect them with kubernetes operated prometheus.
Useful influxdb-exporter Helm chart: https://artifacthub.io/packages/helm/k8s-at-home/influxdb-exporter
Modified from: Proxmox via Prometheusby Pietro Saccardi
Data source config
Collector config:
Upload an updated version of an exported dashboard.json file from Grafana
| Revision | Description | Created | |
|---|---|---|---|
| Download |
Metrics Endpoint (Prometheus)
Easily monitor any Prometheus-compatible and publicly accessible metrics URL with Grafana Cloud's out-of-the-box monitoring solution.
Learn more