Mimir / Reads resources
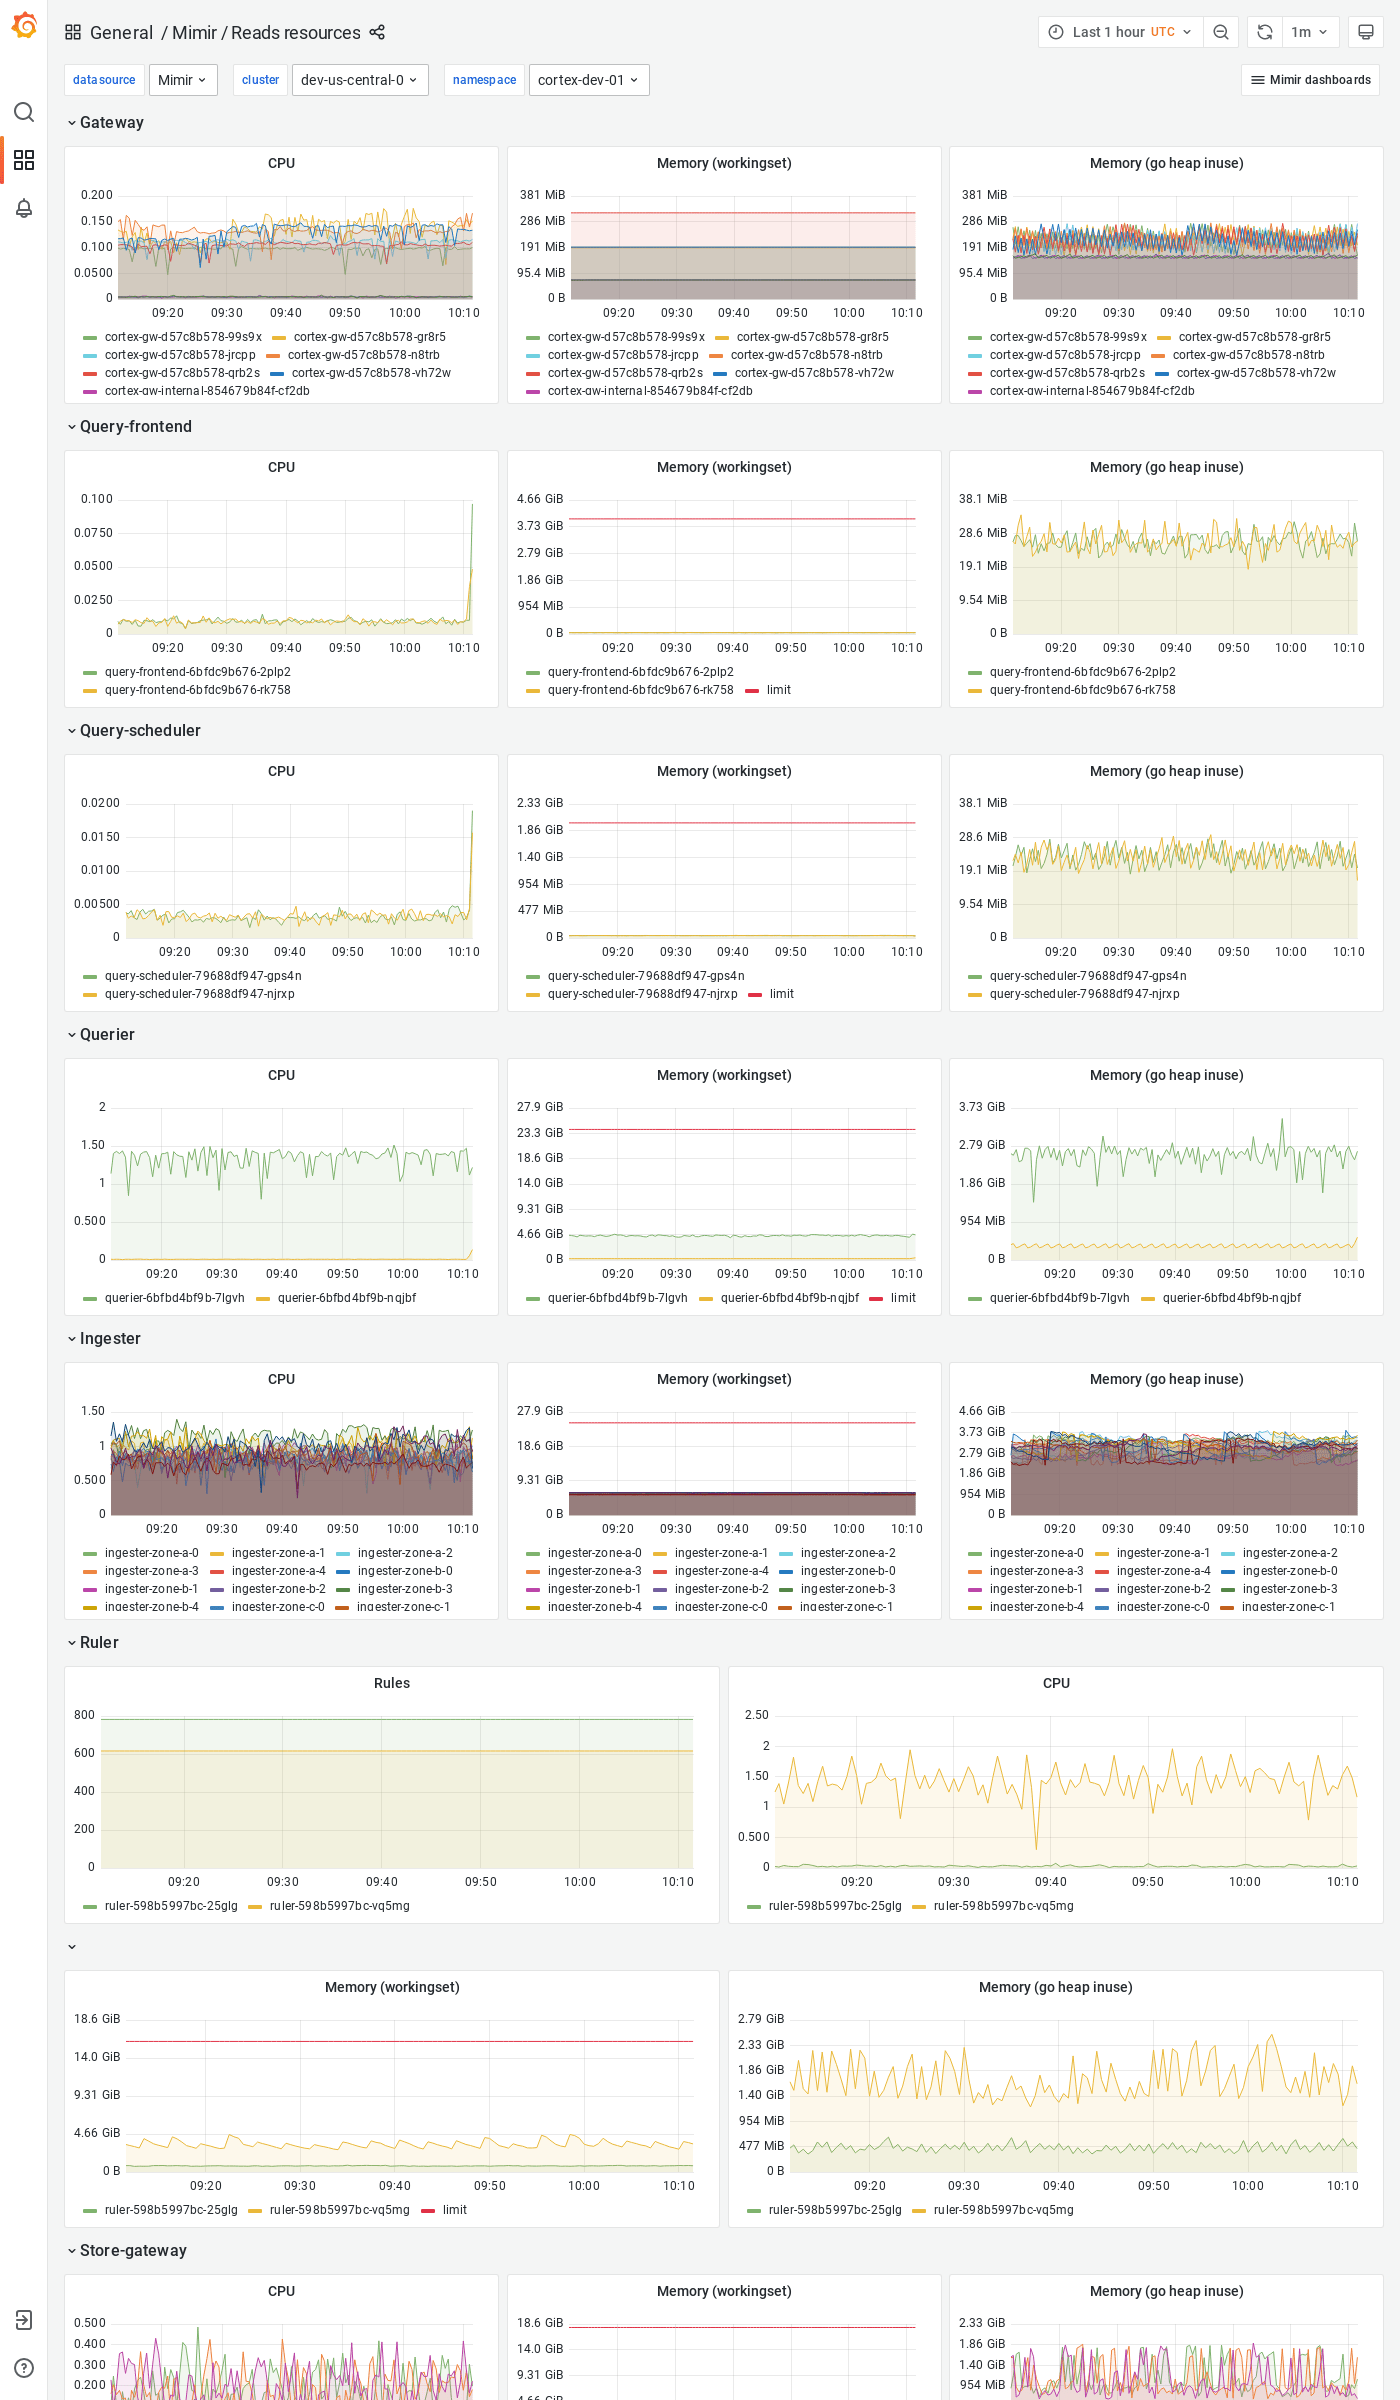
The Reads resources dashboard shows CPU, memory, disk, and other resources utilization metrics. The dashboard isolates each service on the read path into its own section and displays the order in which a read request flows.
Grafana Mimir is an open source software project that provides a scalable long-term storage for Prometheus. For more information, visit Grafana Mimir.
Data source config
Collector type:
Collector plugins:
Collector config:
Revisions
Upload an updated version of an exported dashboard.json file from Grafana
| Revision | Description | Created | |
|---|---|---|---|
| Download |
Grafana Mimir (self-hosted)
Easily monitor your self-hosted instance of Grafana Mimir, an open source, horizontally scalable, highly available, multi-tenant TSDB, with Grafana Cloud's out-of-the-box monitoring solution.
Learn more