
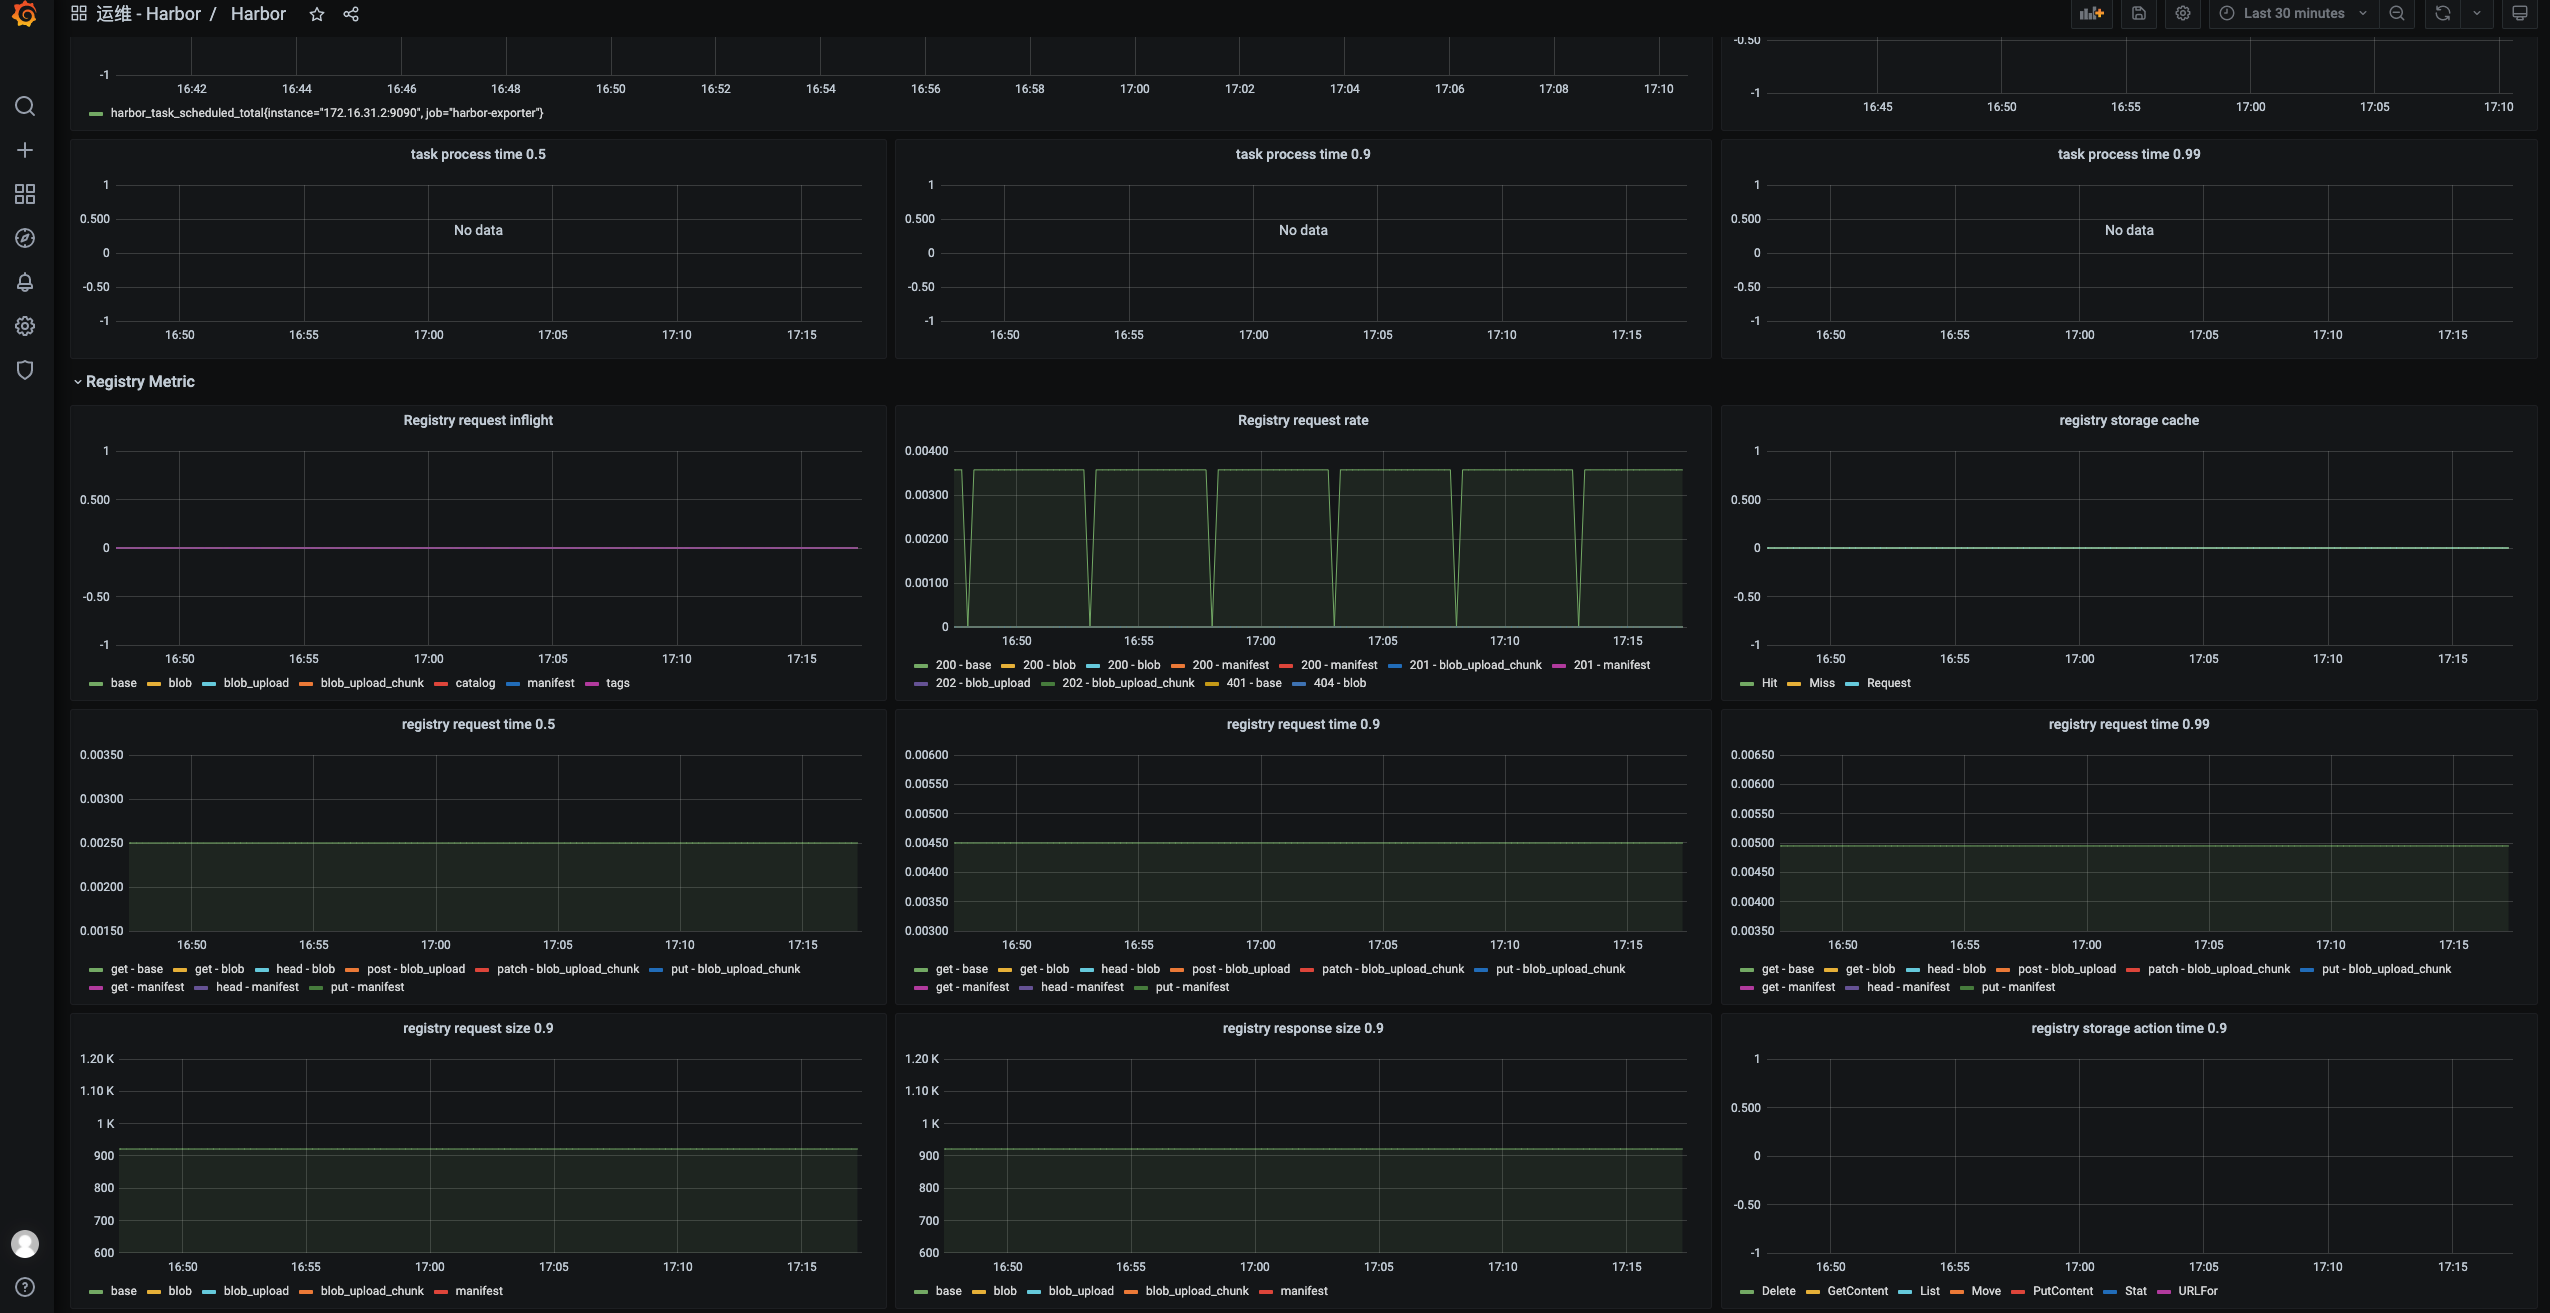
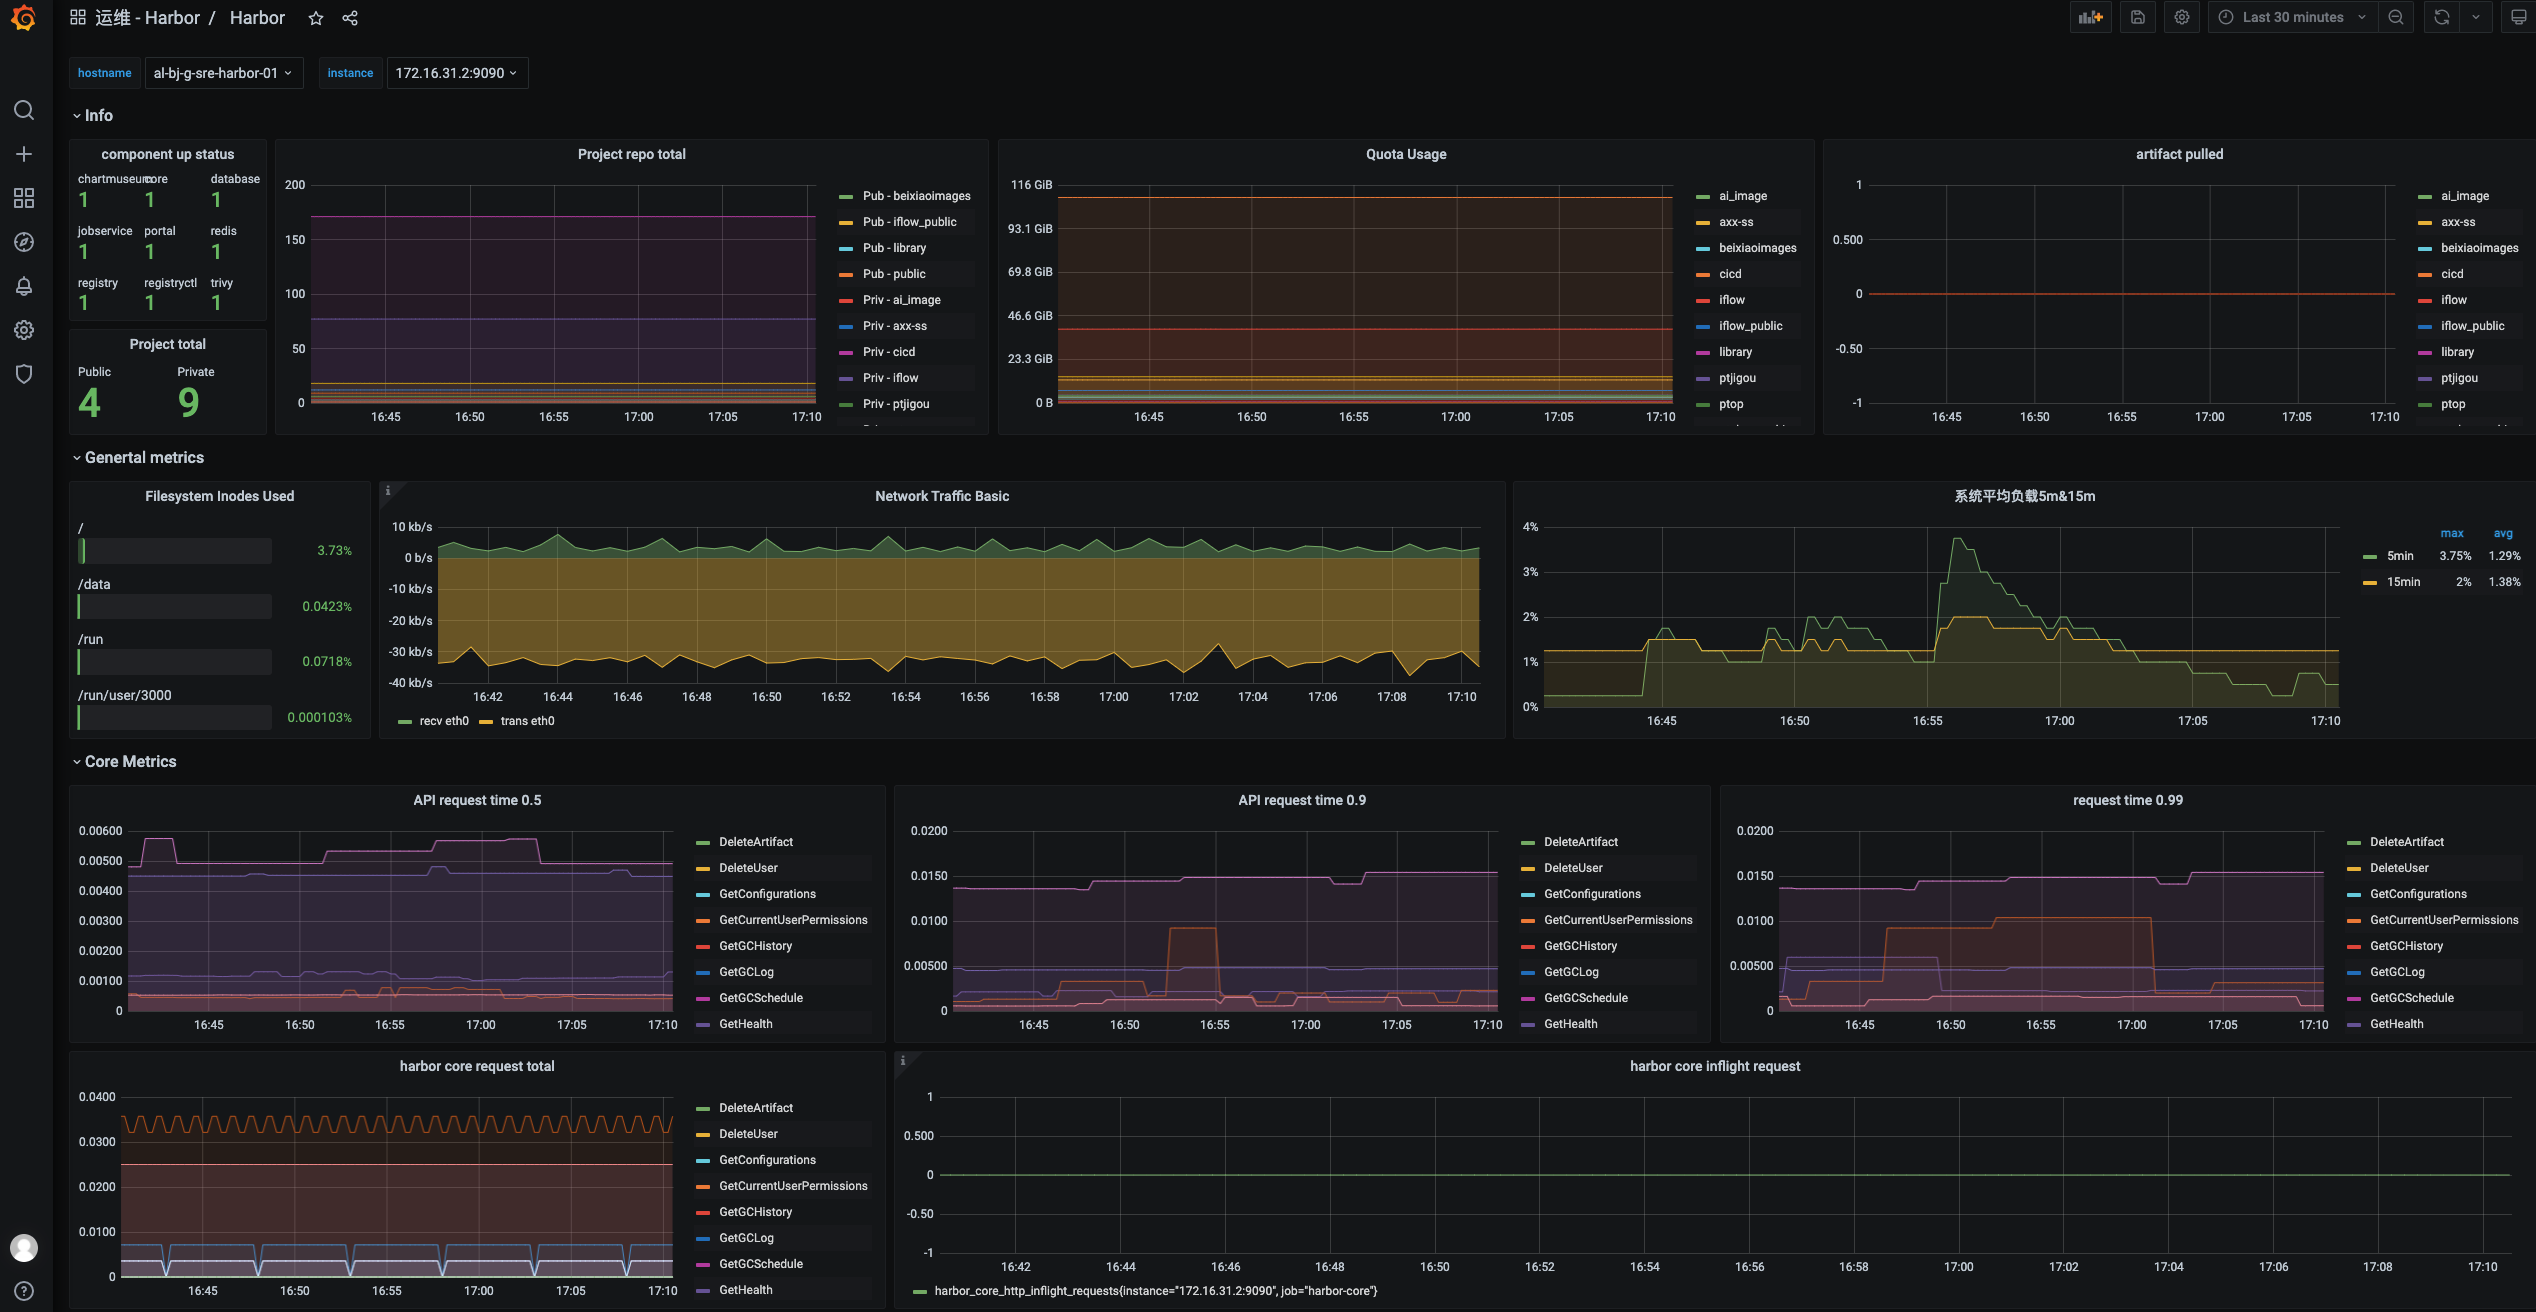
Harbor
修改自harbor官方仓库:https://github.com/goharbor/harbor/edit/master/contrib/grafana-dashborad/metrics-example.json
exporter
harbor_exporter
Version
harbor 2.4.1
prometheus.yaml
- job_name: 'harbor-exporter'
scrape_interval: 20s
static_configs:
# Scrape metrics from the Harbor exporter component
- targets: ['172.16.31.2:9090']
-
job_name: 'harbor-core'
scrape_interval: 20s
params:
Scrape metrics from the Harbor core component
comp: ['core']
static_configs:
- targets: ['172.16.31.2:9090']
-
job_name: 'harbor-registry'
scrape_interval: 20s
params:
Scrape metrics from the Harbor registry component
comp: ['registry']
static_configs:
- targets: ['172.16.31.2:9090']
Data source config
Collector type:
Collector plugins:
Collector config:
Revisions
Upload an updated version of an exported dashboard.json file from Grafana
| Revision | Description | Created | |
|---|---|---|---|
| Download |