njmon Dashboard For Linux
Dashboard for Linux for a single server (njmon + telegraf + prometheus)
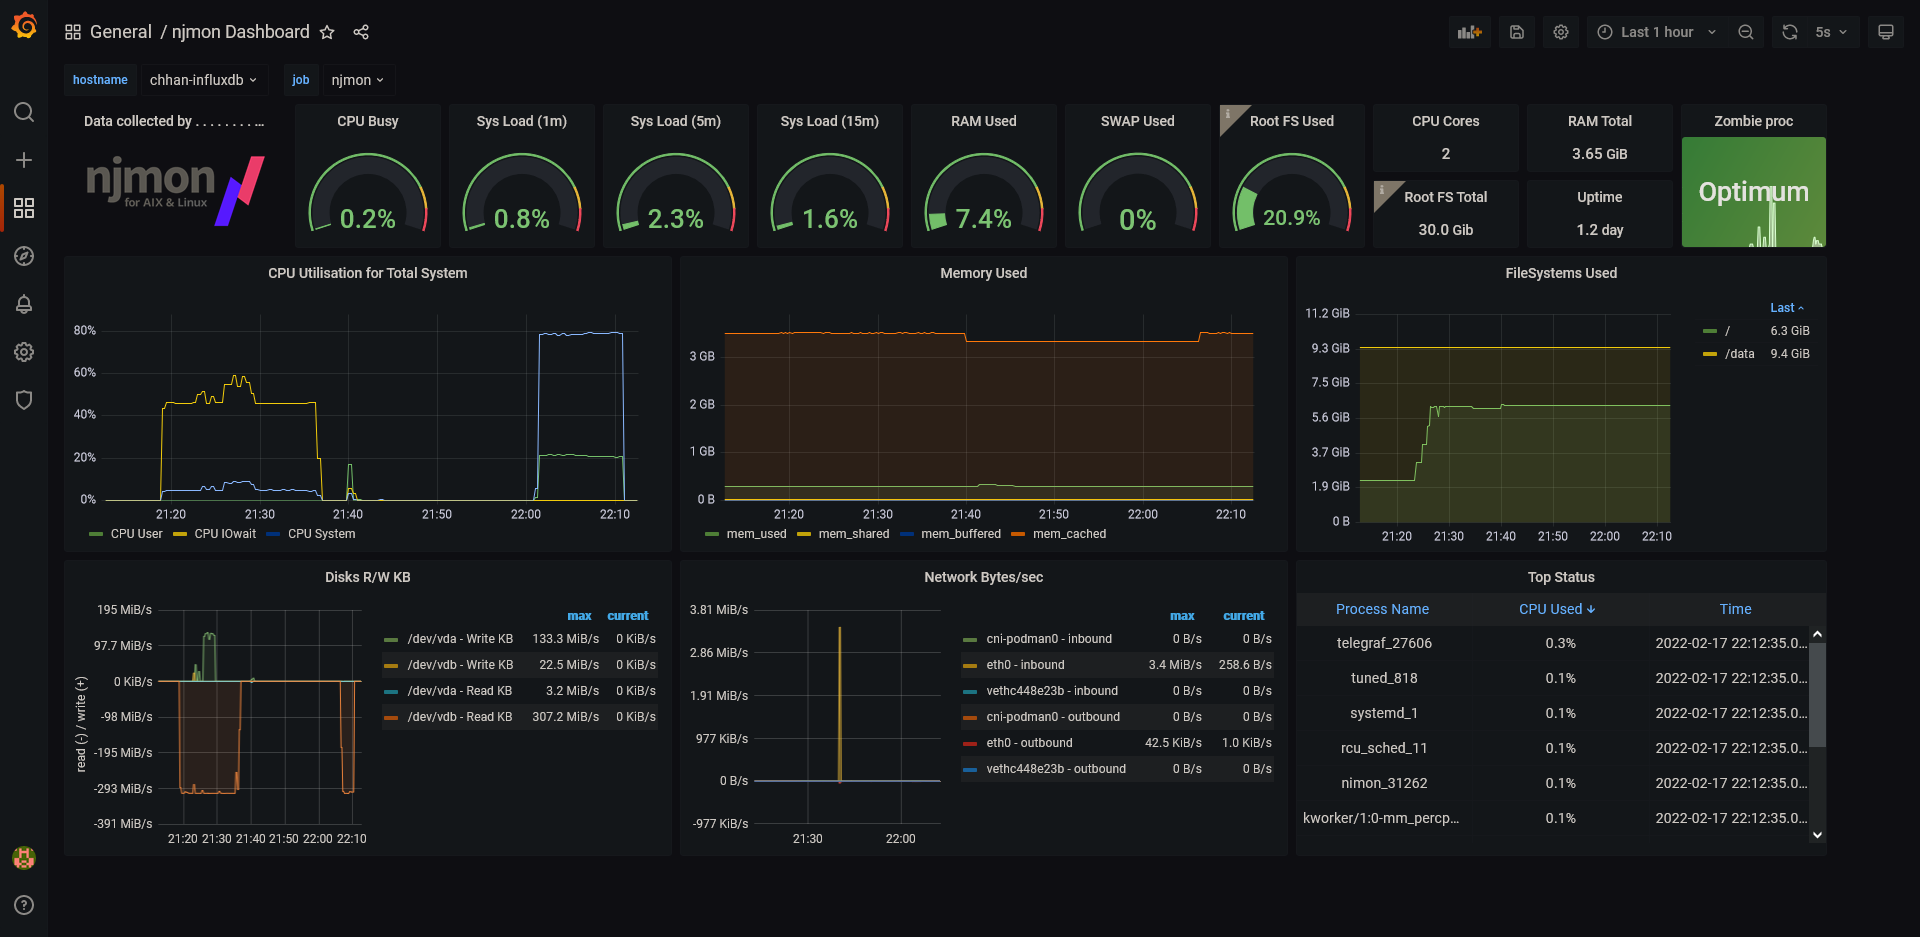
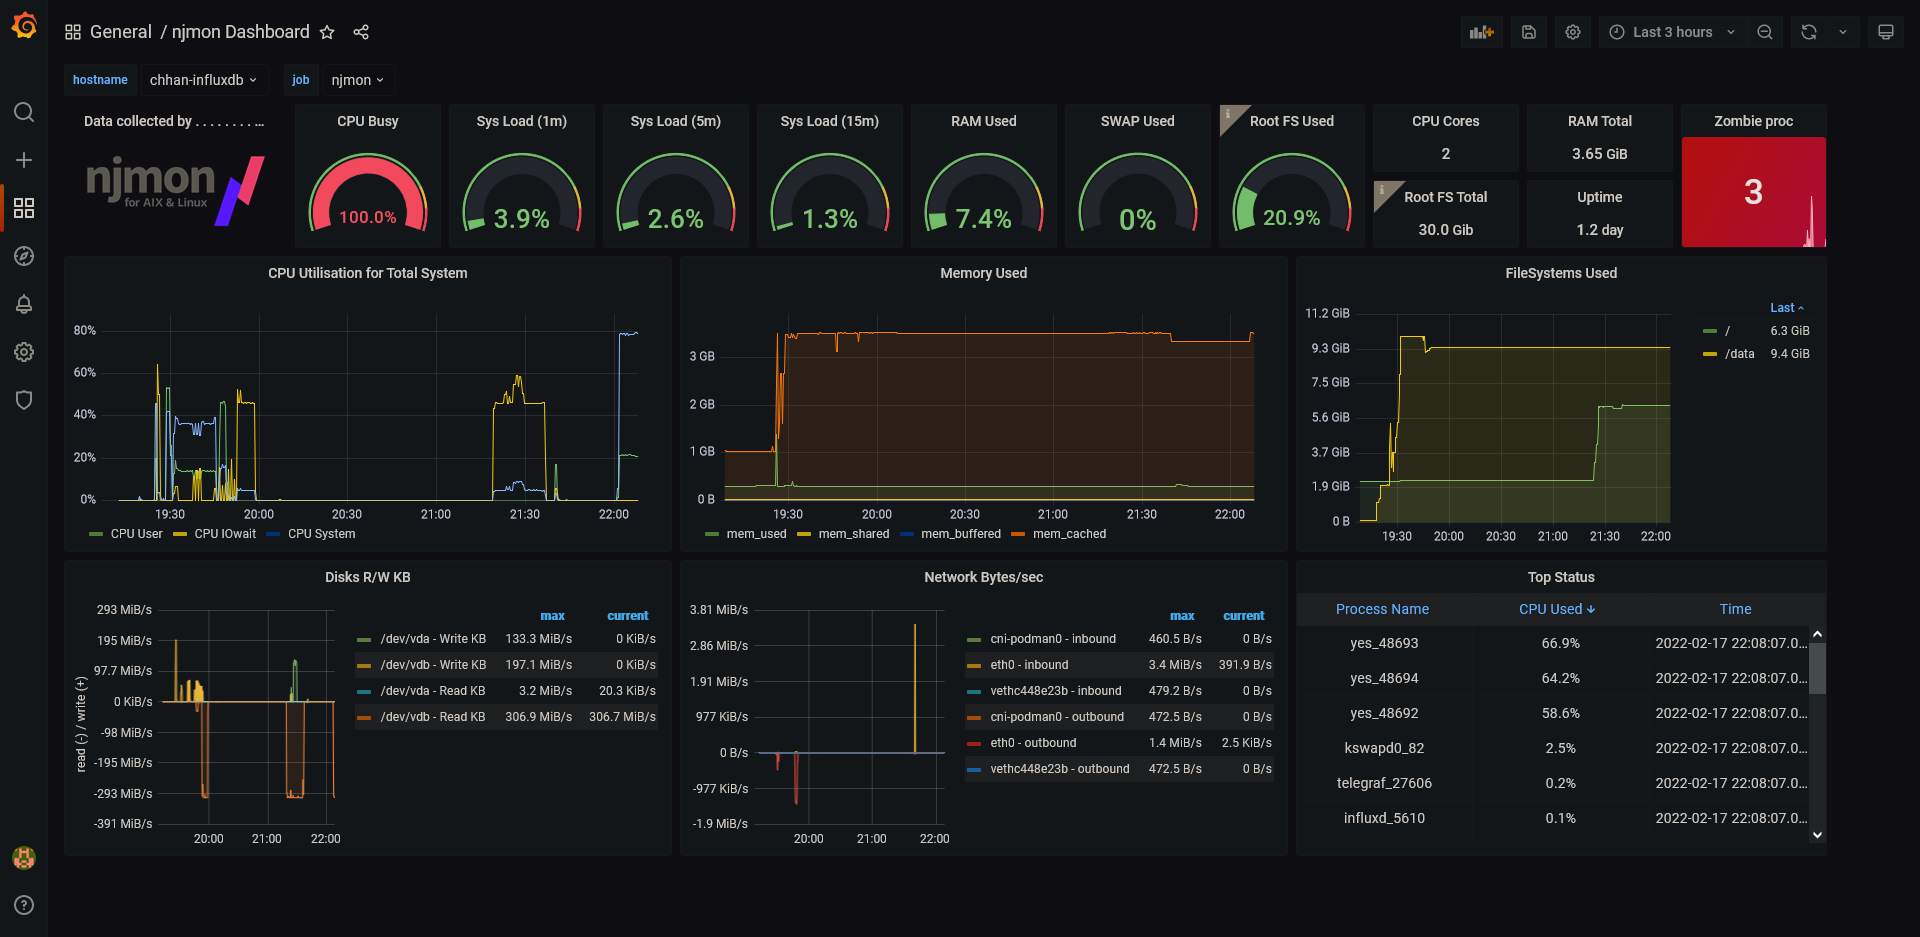
njmon Simple Dashboard for Linux System
Dashboard for Linux for a single server (down-drop).
- Tested with CentOS Linux 7 (
njmon+telegraf+prometheus) - Tested with Rocky Linux 8 (
njmon+telegraf+prometheus) - Tested with Ubuntu 20.04 LTS (
njmon+telegraf+prometheus)
External resources
Data source config
Collector type:
Collector plugins:
Collector config:
Revisions
Upload an updated version of an exported dashboard.json file from Grafana
| Revision | Description | Created | |
|---|---|---|---|
| Download |
Linux Server
Monitor Linux with Grafana. Easily monitor your Linux deployment with Grafana Cloud's out-of-the-box monitoring solution.
Learn more