Libvirt Dashboard
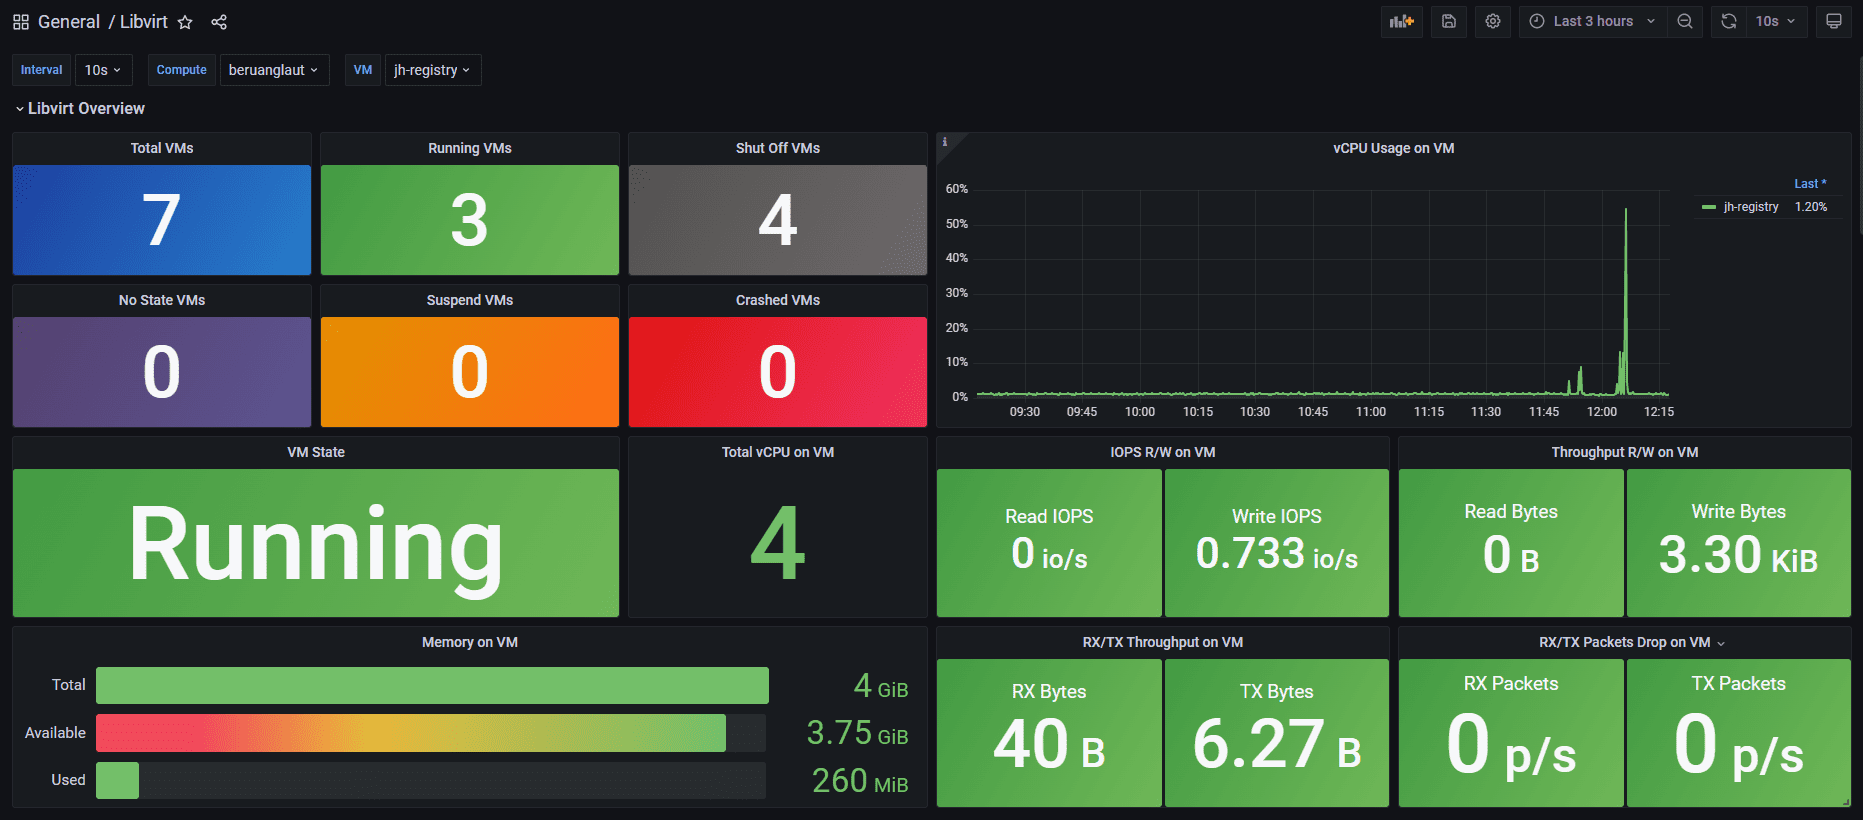
A simple dashboard that can monitor libvirt KVM
To use this dashboard, please use the following exporter prometheus-libvirt-exporter to monitor your libvirt KVM
This dashboard includes panels for the following metrics:
- Number of Total, Running, Shut Off, No State, Suspended, Crashed & VM state
- vCPU Total & Used
- Memory Total, Available & Used
- R/W IOPS & R/W Bytes Throughput
- RX/TX Throughput
- Data Exporter to CSV
Note: This dashboard will not be compatible with OpenStack, so just pure libvirt KVM dashboard
You may need to change the job name on prometheus.yml to libvirt_exporter so you don't have to adjust it on the dashboard
Data source config
Collector config:
Upload an updated version of an exported dashboard.json file from Grafana
| Revision | Description | Created | |
|---|---|---|---|
| Download |

