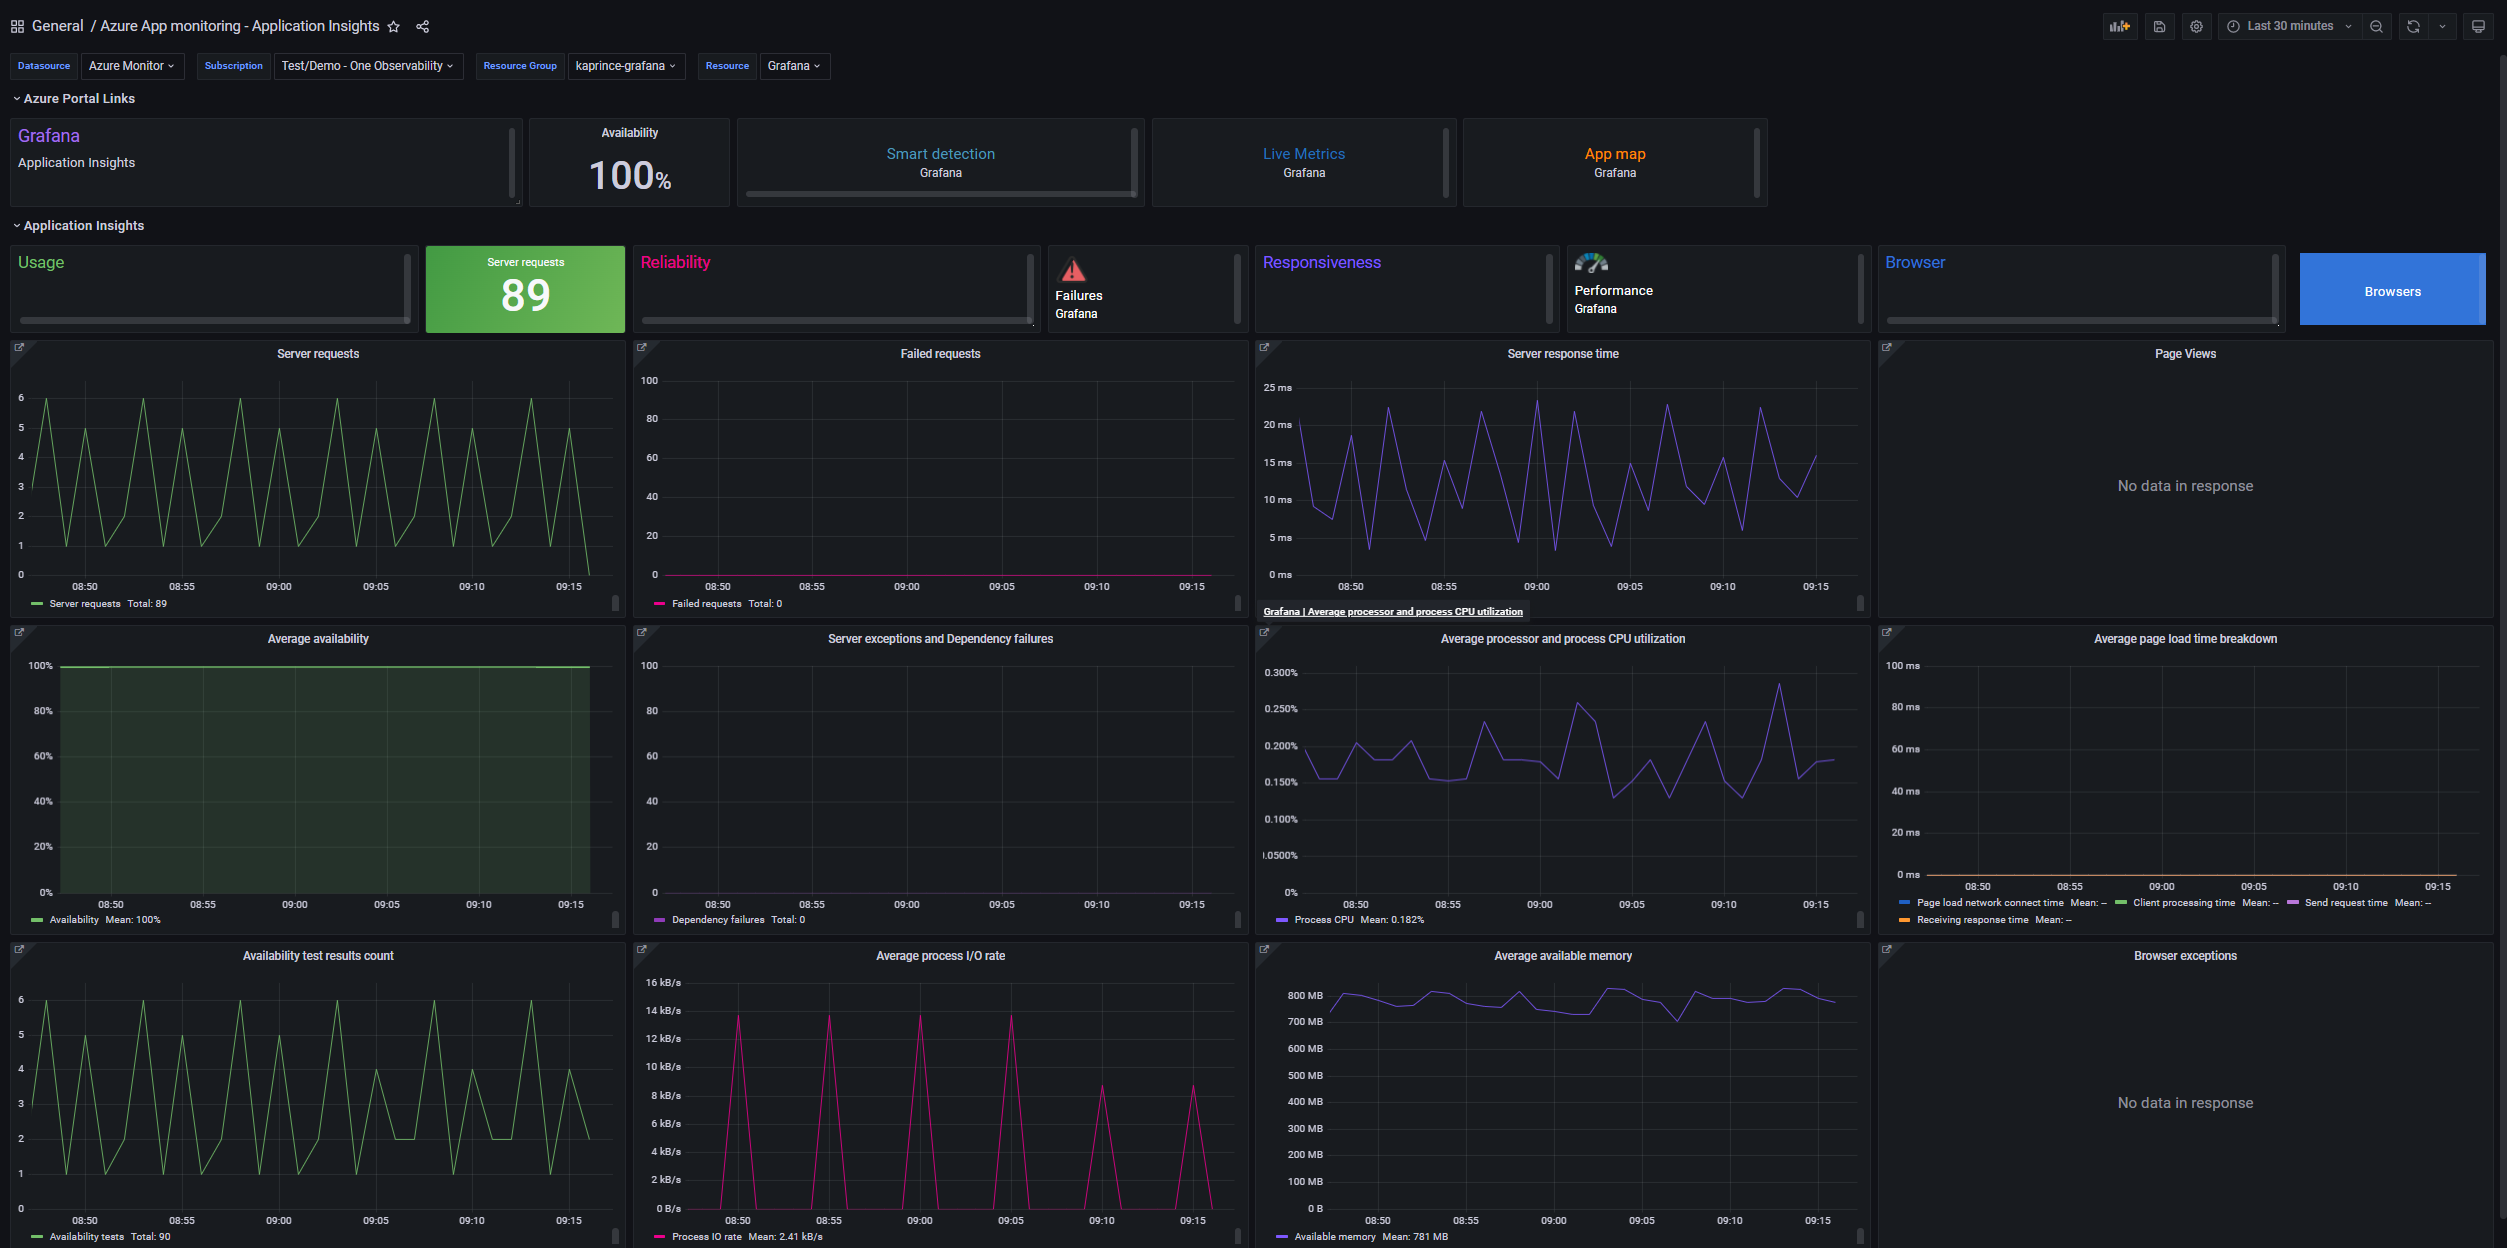
Azure / Insights / Applications - Overview
The dashboard provides insights of Azure Apps via different metrics for app monitoring through Application Insights.
Using Azure Monitor data source, this dashboard provides insights for app monitoring through a number of Application Insights metrics that will allow you to better understand your application's usage, reliability, responsiveness and browser usage. You'll have access to key details like server requests, failed requests, server response time, among others.
More information:
Send your feedback to azmongrafana@microsoft.com
Data source config
Collector config:
Upload an updated version of an exported dashboard.json file from Grafana
| Revision | Description | Created | |
|---|---|---|---|
| Download |
Azure Cosmos DB
With the Grafana plugin for Azure Cosmos DB, you can quickly visualize and query your Azure Cosmos DB data from within Grafana.
Learn more