Device
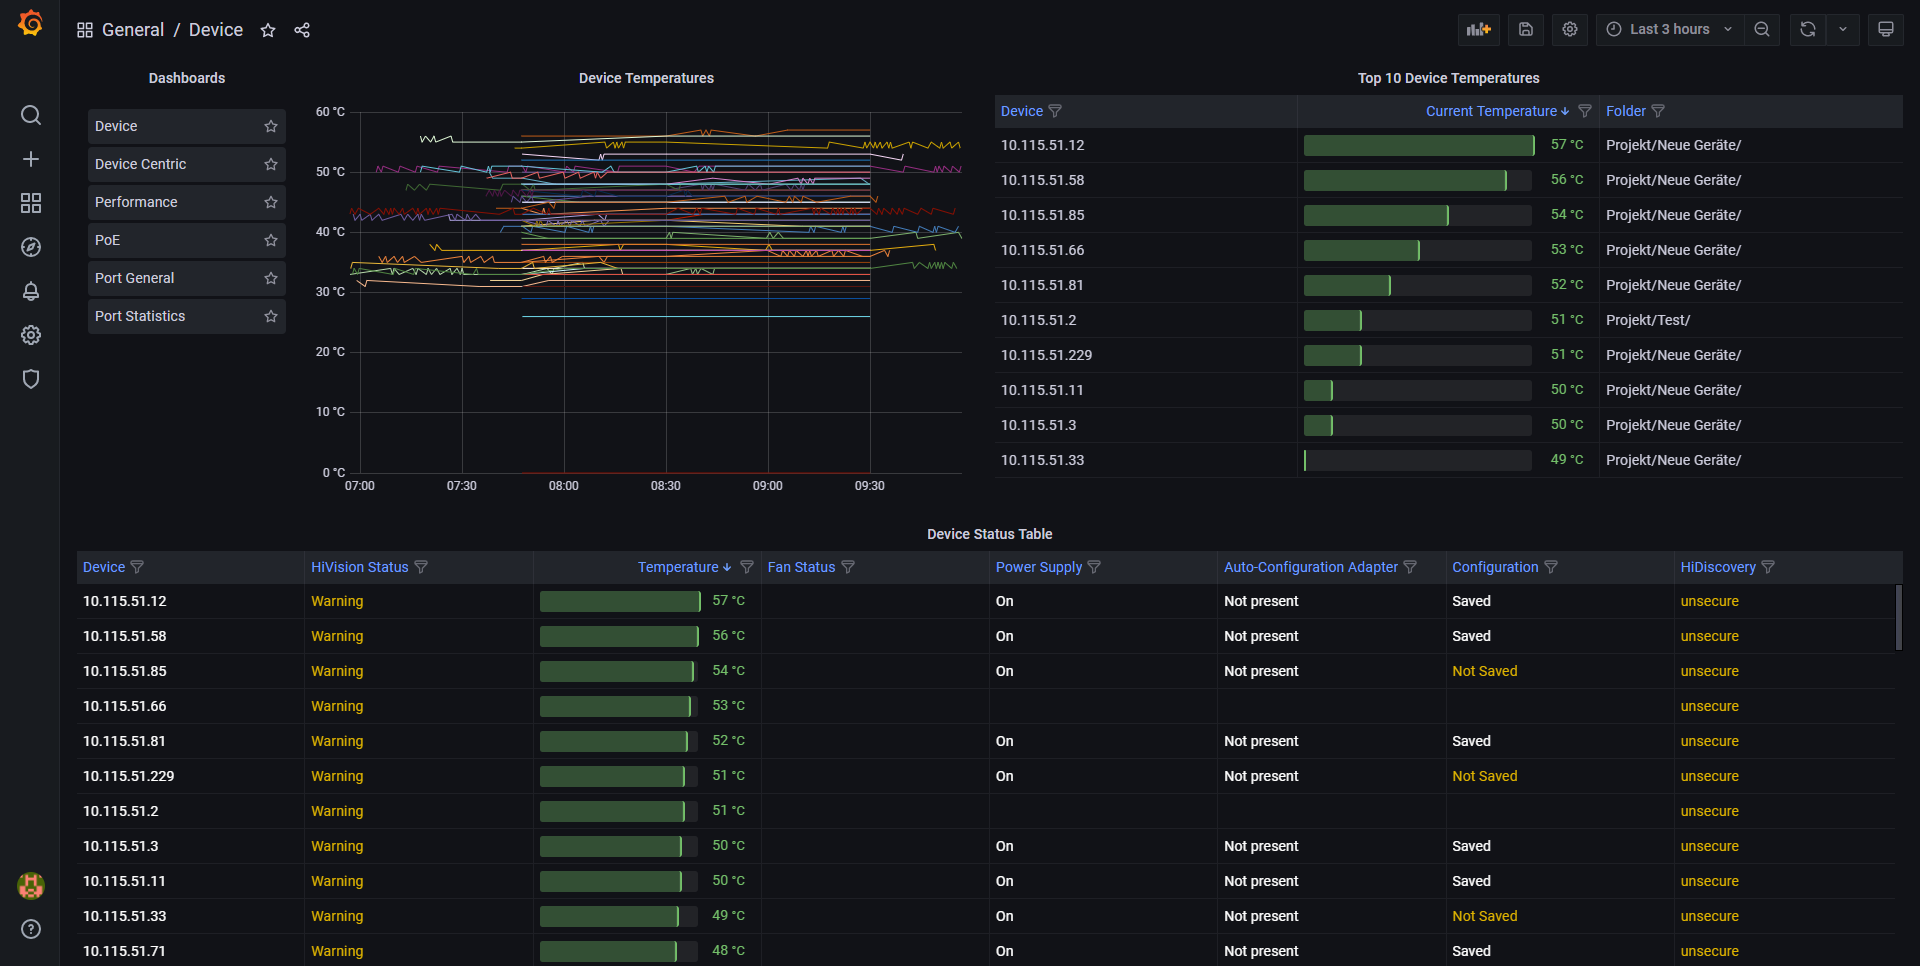
This dashboard displays important information about the general status of Hirschmann switches and routers.
The status of network devices is the most valuable indicator of overall network health. The Device Dashboard displays parameters in three categories. Device status summary. Physical device status. Logical device status. If you only deploy one dashboard, this is the one to pick.
Data source config
Collector config:
Upload an updated version of an exported dashboard.json file from Grafana
| Revision | Description | Created | |
|---|---|---|---|
| Download |

