Sense Collector - Monitor & Detection
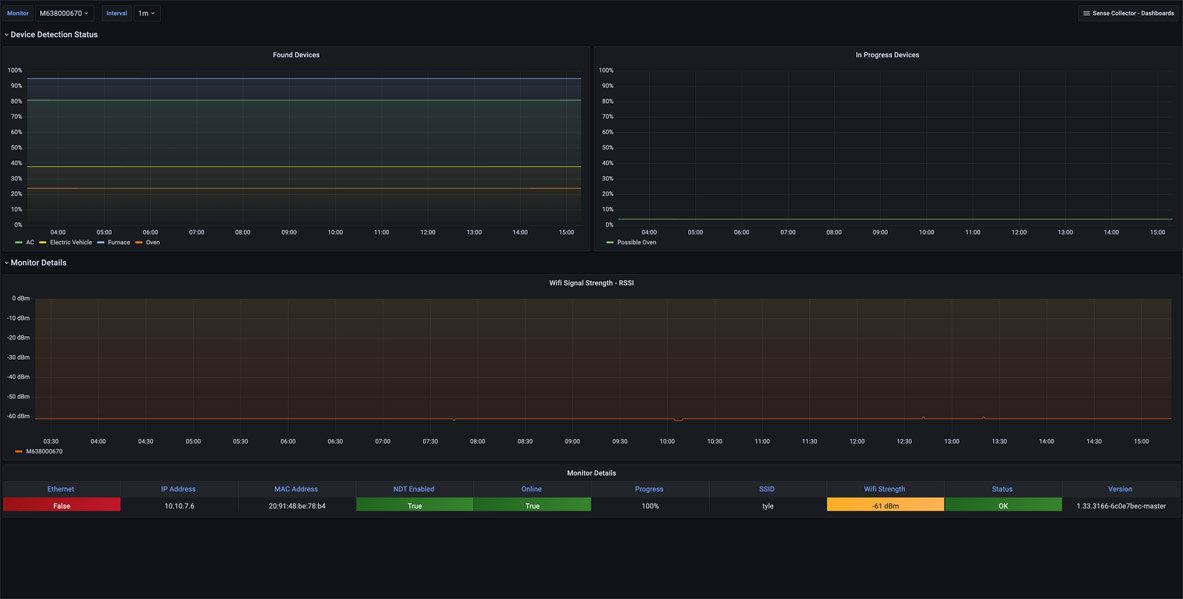
The Monitor & Detection dashboard provides observability of the monitor itself.
Device Detection Status: Represents Device Detection Status for both "Found" and "In Progress" devices.
Wifi Signal Strength - RSSI: Represents the Wifi signal strength of your Sense monitor.
Monitor Details: This panel shows current information about Online status, General Status, Learning Progress, IP Address, MAC Address, Wifi SSID, Wifi Strength, Ethernet, NDT Enabled, and software version.
More details on these Sense Collector dashboards may be found:
Github Project: https://github.com/lux4rd0/sense-collector/
Data source config
Collector type:
Collector plugins:
Collector config:
Revisions
Upload an updated version of an exported dashboard.json file from Grafana
| Revision | Description | Created | |
|---|---|---|---|
| Download |