1 Linux Stats with Node Exporter
Monitor Linux host (VM, Server, OS), your personal machines with preconfigured beautiful dashboard.
Linux Stats with Node Exporter
Monitoring Linux host metrics, with beautiful Grafana dashboard.
To quickly setup Prometheus node_exporter.
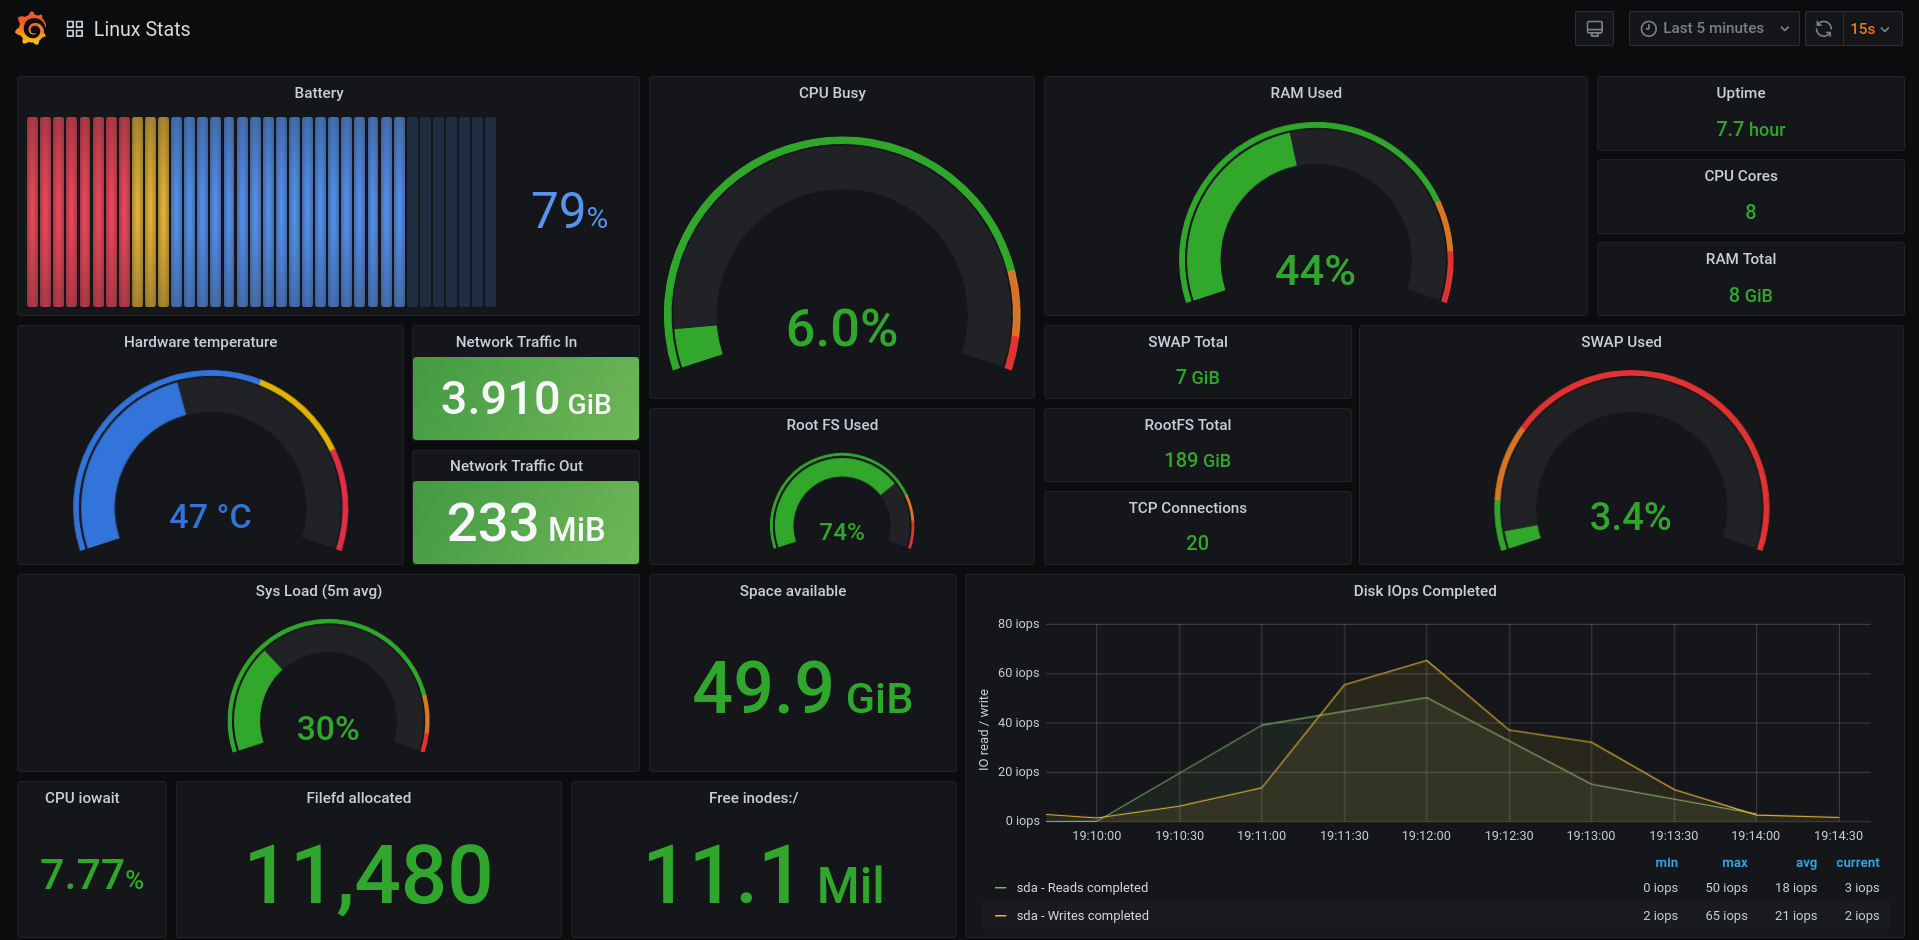
This dashboard includes panels for the following metrics:
- CPU Usage
- Load Average
- Network Usgae
- Memory
- Disk
- Sys basics
Variables used:
$job = label_values(node_uname_info, job)
$node = label_values(node_uname_info{job="$job"}, instance)
$network_interface = label_values(node_network_info{operstate="up"}, device)
Github: https://github.com/3xploitGuy/linuxstats
Screenshot :

[Update] :
18/07/2021
- Initial release
10/10/2021
- Added variable to detect active network interface name.
Data source config
Collector type:
Collector plugins:
Collector config:
Revisions
Upload an updated version of an exported dashboard.json file from Grafana
| Revision | Description | Created | |
|---|---|---|---|
| Download |
Linux Server
Monitor Linux with Grafana. Easily monitor your Linux deployment with Grafana Cloud's out-of-the-box monitoring solution.
Learn more