Windows Exporter Dashboard
Windows Exporter Dashboard Created By Ismaeil Rasoulivand with love
If You've installed windows expxorter already
Open up Control Panel and uninstall windows_exporter from Programs and Features
Usage
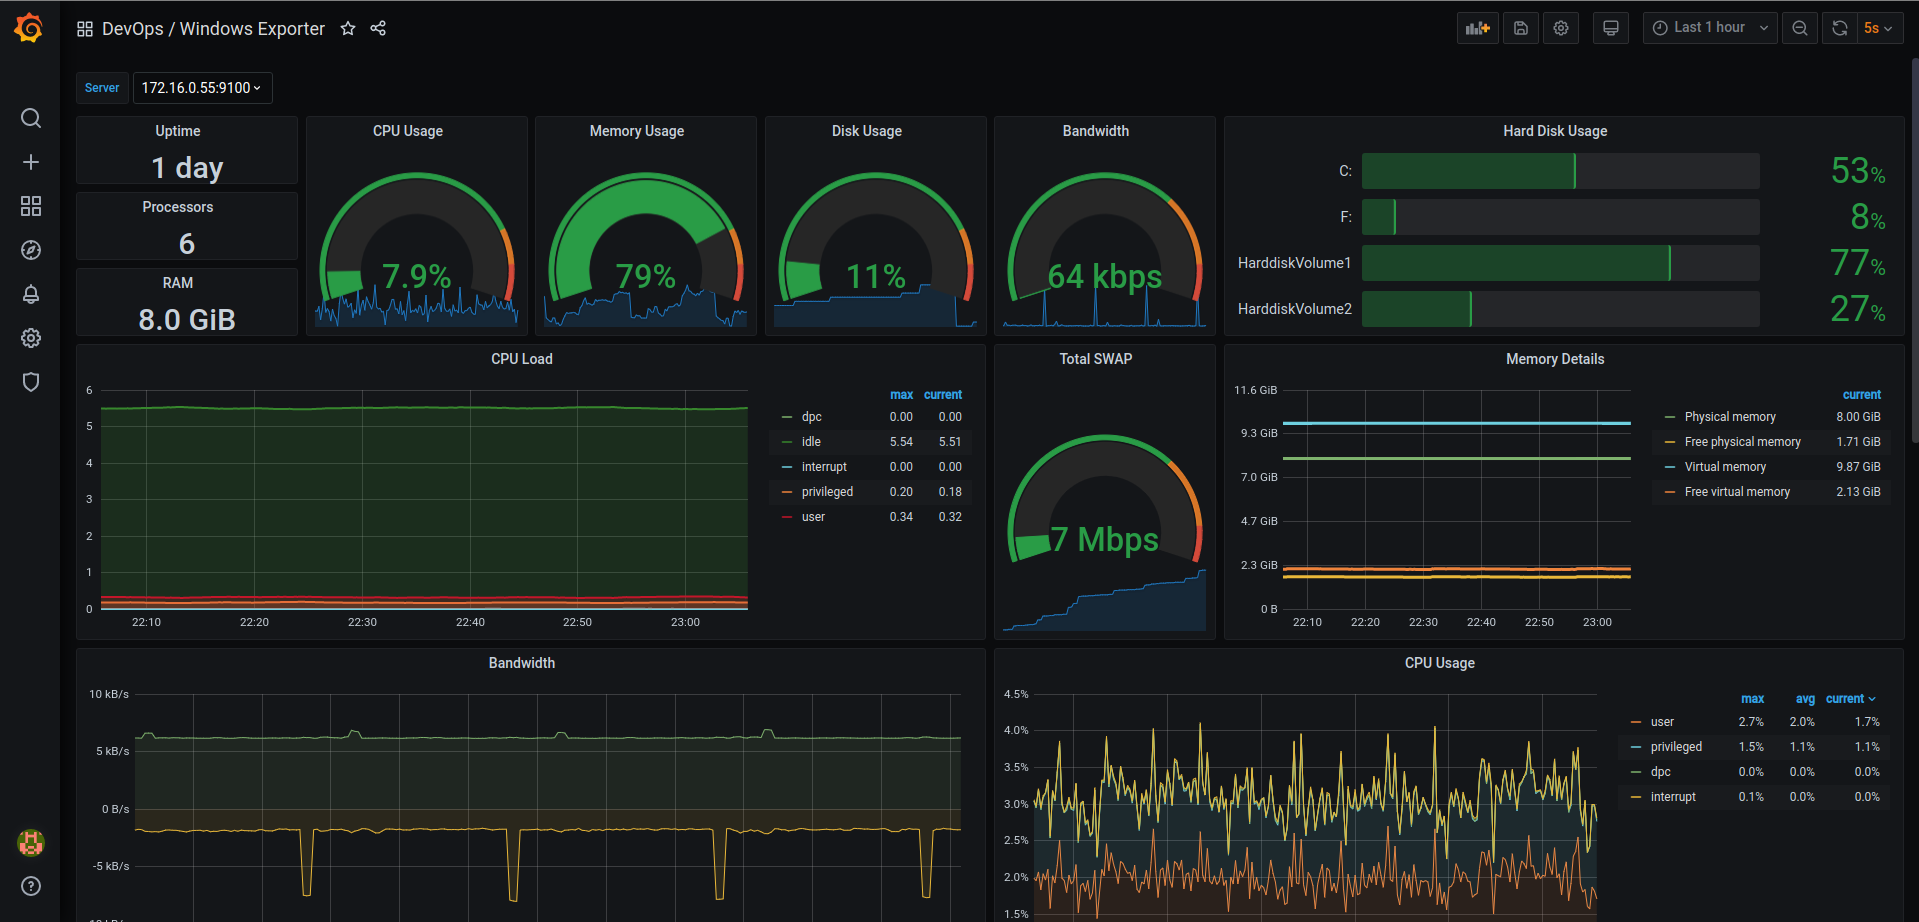
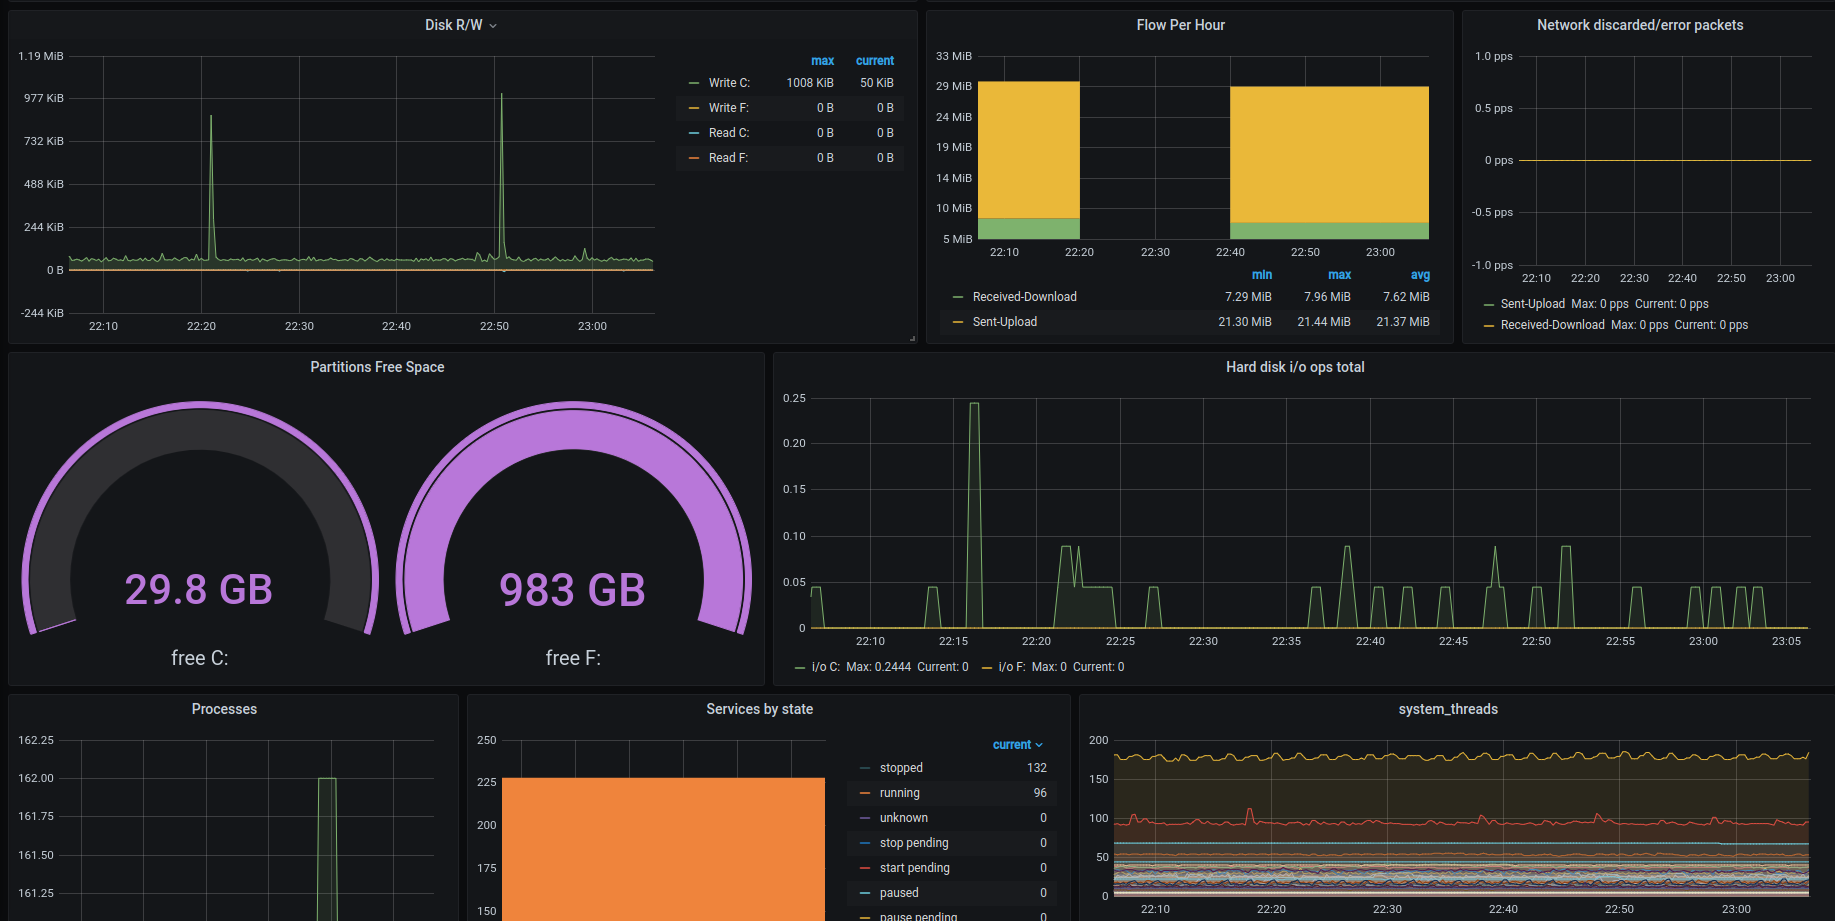
To use this dashboard you must install windows exporter from here and after that you do not have to do any other thing. dashboard will show what you saw in snapshots.
How you can install windows_eporter to collect data for this dashboard:
- Download latest version of windows_exporter from here (download
.msifile) - Open up a command prompt with administrator privileges (
Run as administrator) - Change your directory where you've downloaded
.msifile at - Run below command :
msiexec /i windows_exporter-0.16.0-amd64.msi ENABLED_COLLECTORS="ad,adfs,cache,cpu,cpu_info,cs,container,dfsr,dhcp,dns,fsrmquota,iis,logical_disk,logon,memory,msmq,mssql,netframework_clrexceptions,netframework_clrinterop,netframework_clrjit,netframework_clrloading,netframework_clrlocksandthreads,netframework_clrmemory,netframework_clrremoting,netframework_clrsecurity,net,os,process,remote_fx,service,tcp,time,vmware" TEXTFILE_DIR="C:\custom_metrics" LISTEN_PORT="9115"
- Add your VM in to your prometheus server (
prometheus.ymlfile)
You can choose what to collect with ENABLED_COLLECTORS option. to learn more about collectors, look at windows_exporter github page here
View On github
Data source config
Collector type:
Collector plugins:
Collector config:
Revisions
Upload an updated version of an exported dashboard.json file from Grafana
| Revision | Description | Created | |
|---|---|---|---|
| Download |
Windows
Easily monitor your deployment of the Windows operating system with Grafana Cloud's out-of-the-box monitoring solution.
Learn more