Synology DashBoard
A Dashboard to monitor Synology NAS
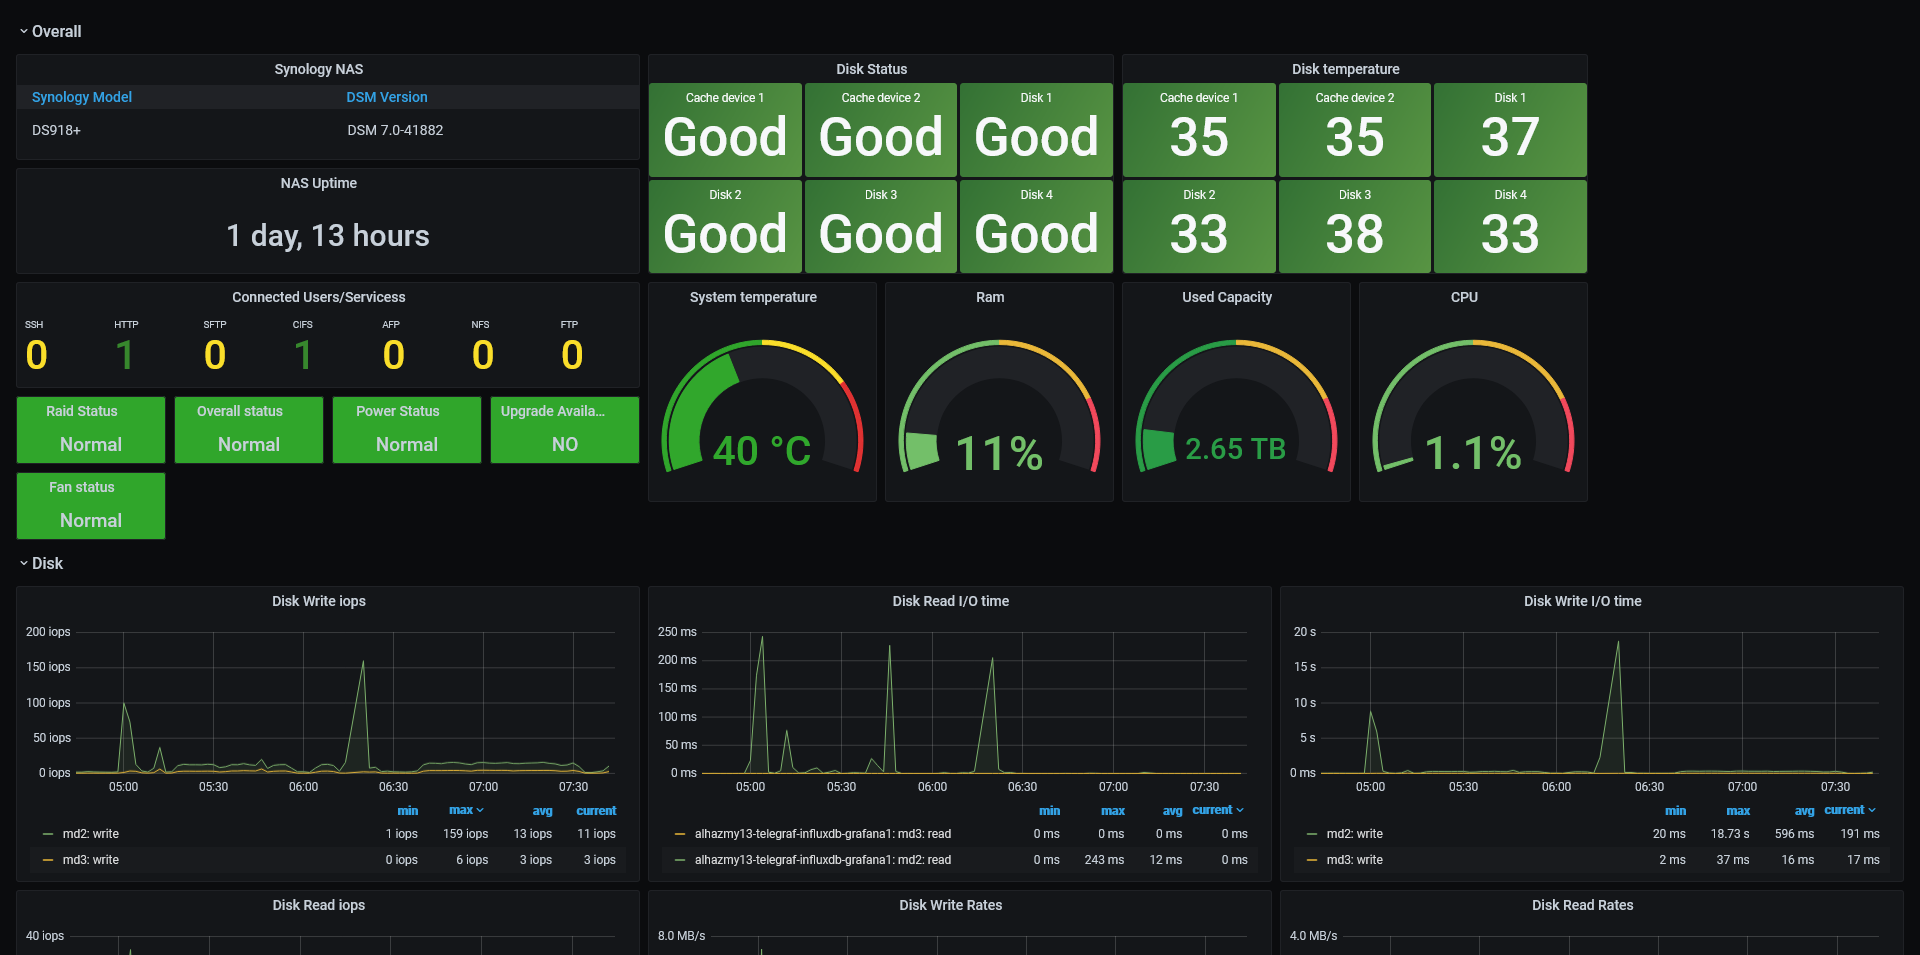
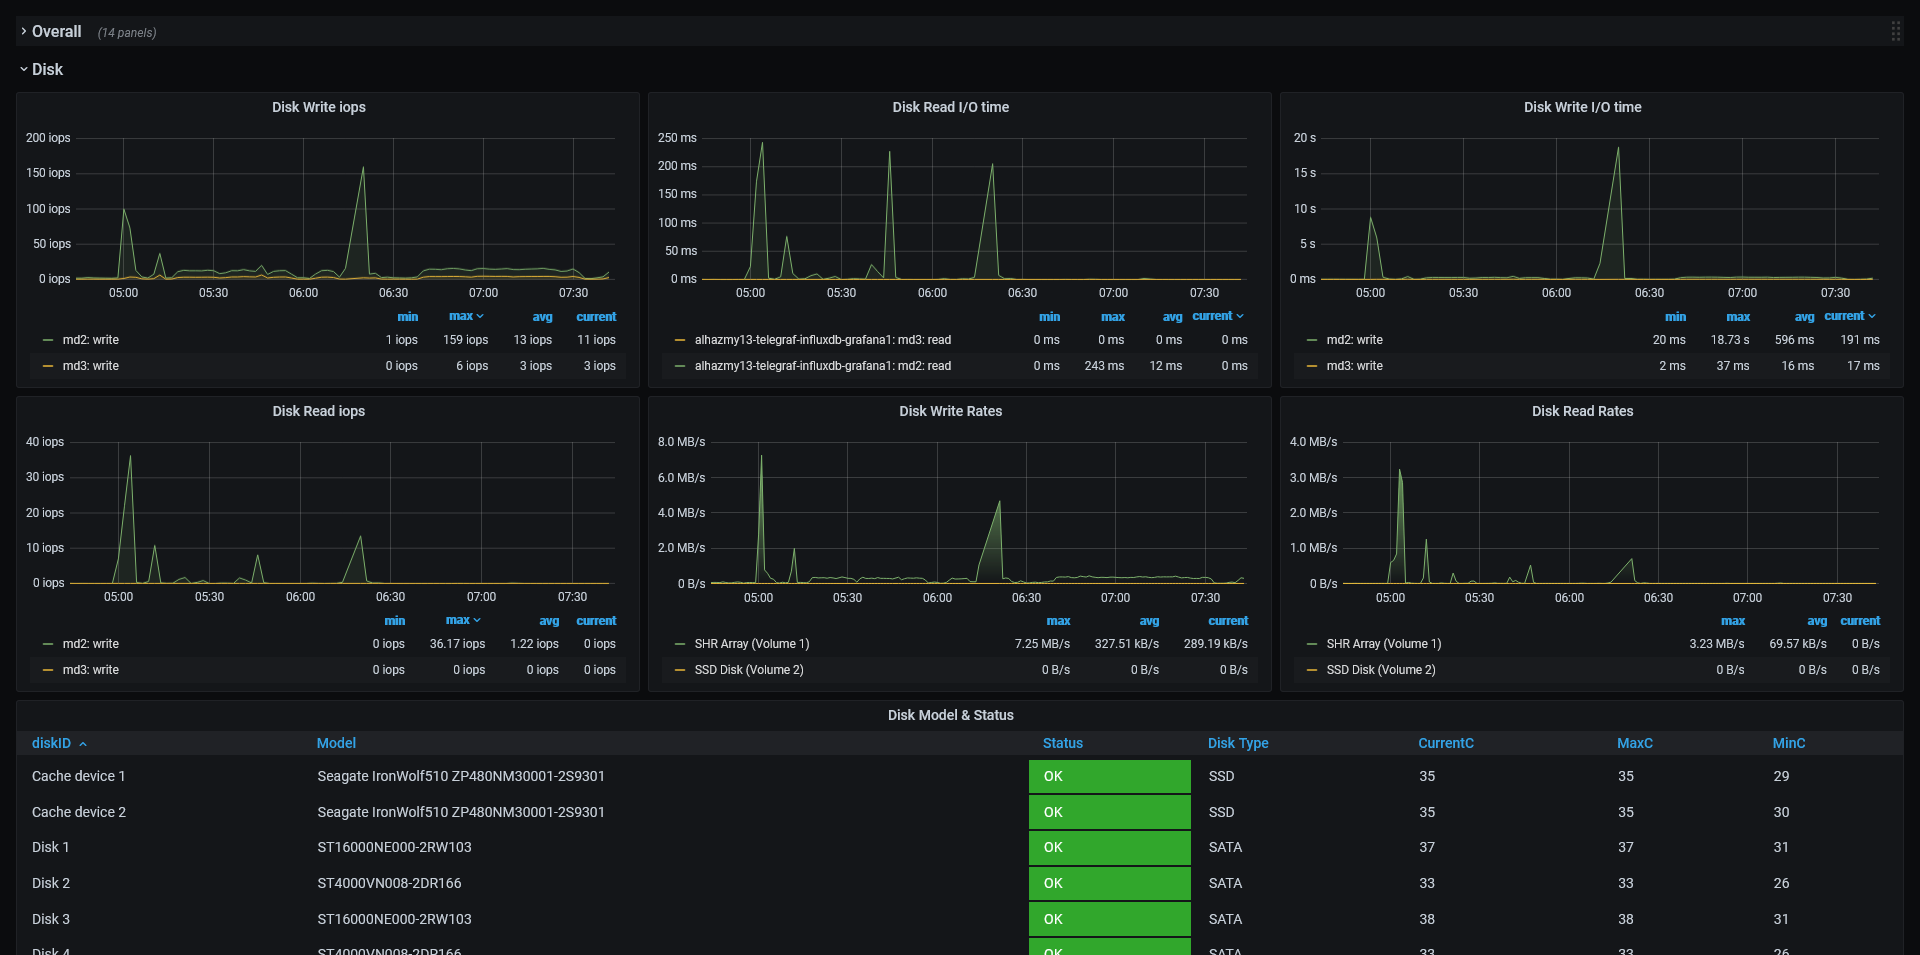
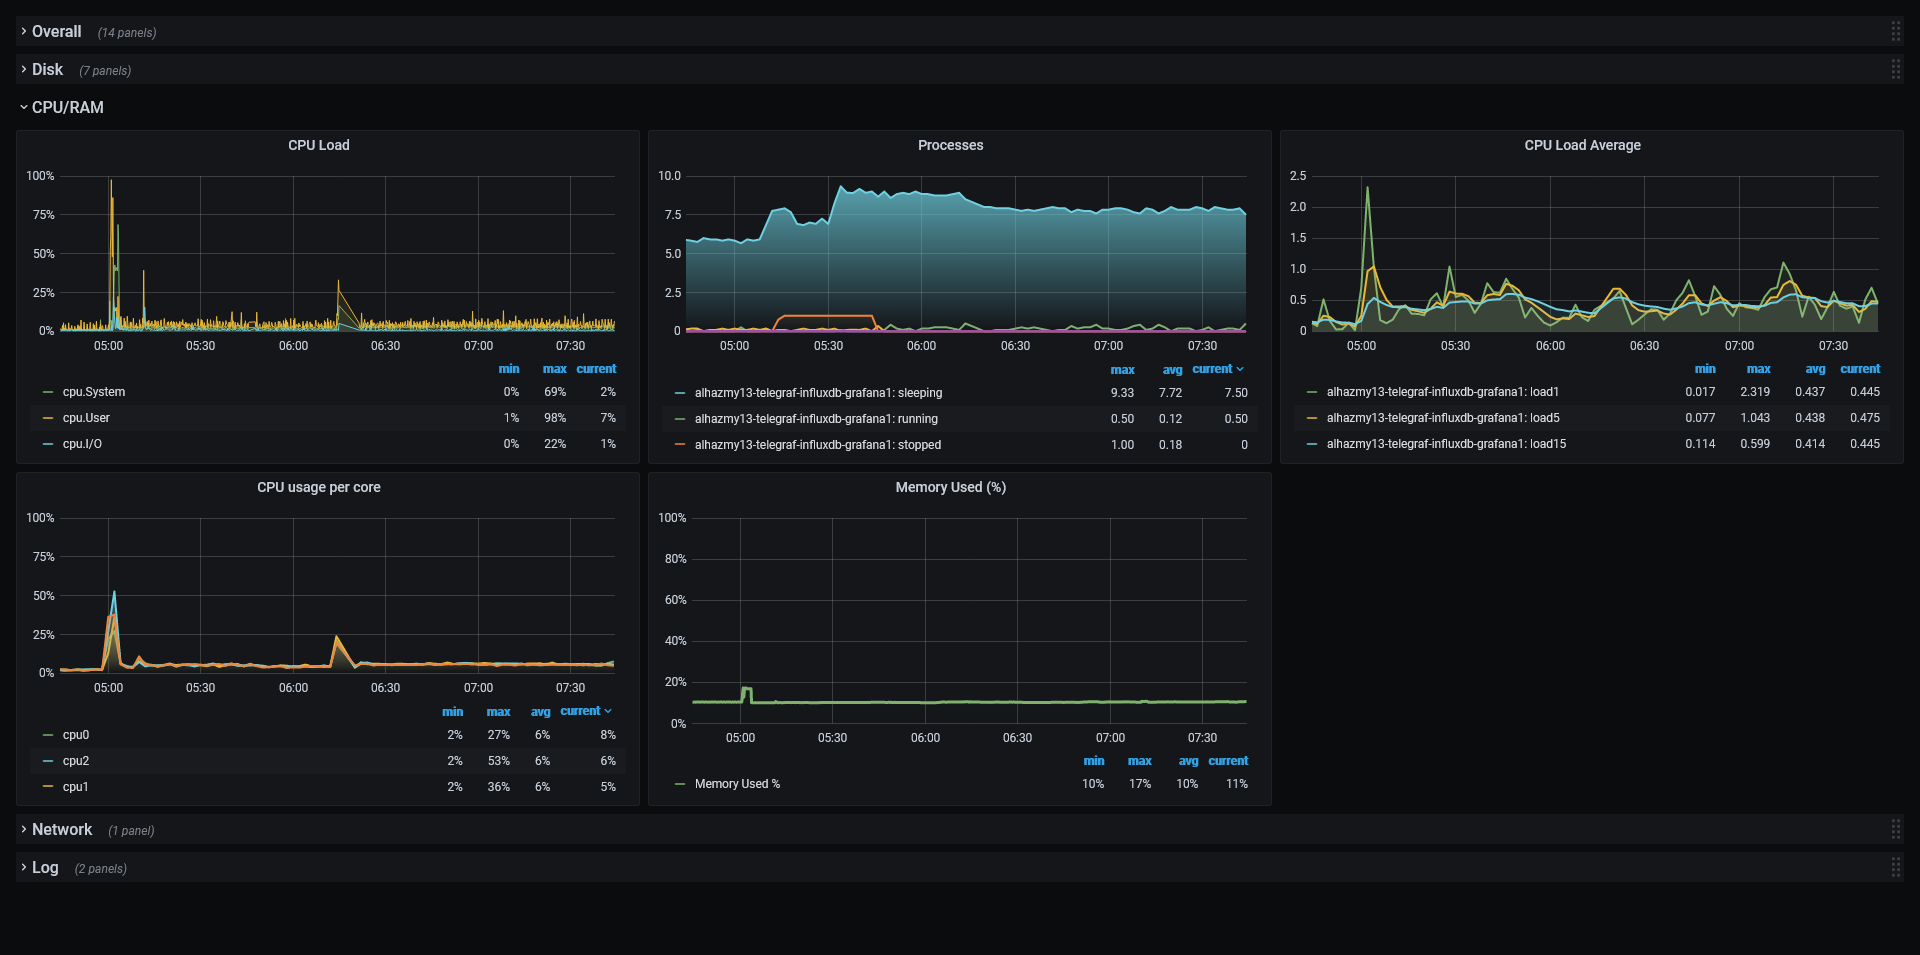
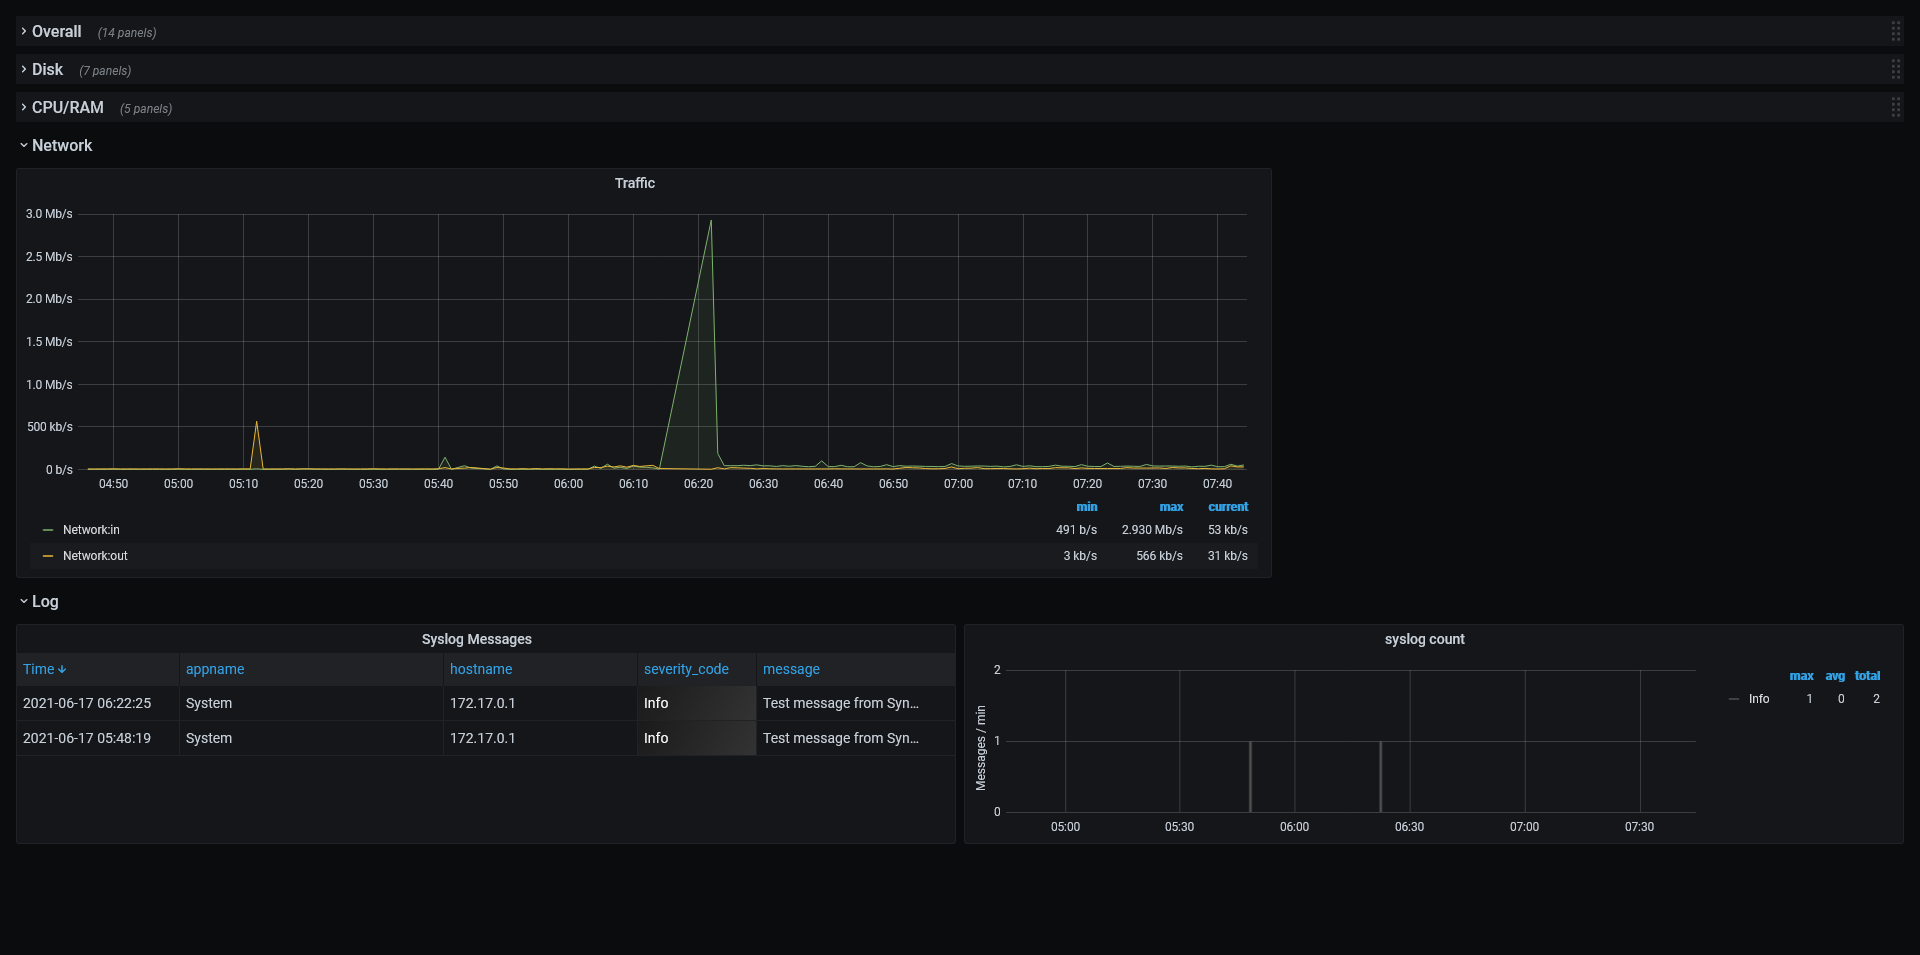
Synology NAS monitoring
The main points of this project are:
- Persistence is supported via mounting volumes to a Docker container.
- Grafana will store its data in SQLite files instead of a MySQL.
- Added snmp packages and Synology NAS MIBS.
- Enable
Run Docker image in your Synology
- Install Docker from Synology package center
- Create two empty folders in your Synology “influxdb” and “grafana”, we need to use it later to mount it to our container.
- Open Docker client from Synslogy > Image > Add > Add from url and paste Hub page url “ https://hub.docker.com/r/alhazmy13/telegraf-influxdb-grafana"
- Wait until it finishes downloading the image
- Click on the image “alhazmy13/telegraf-influxdb-grafana” and then click on Lunch
- Click on Advanced Settings and check “Enable auto-restart.”
- From the Volume tab, click Add folder and select the first folder that we created, “grafana” and on mount Path, paste “/var/lib/grafana”
- From the Volume tab again, click Add Folder and select the second folder that we created “influxdb” and on mount Path paste “/var/lib/influxdb”
- Network Tab keep it in bridge mode
- Port settings, just change Local port for 3003 from Auto to 3003, and port 514 from Auto to 5144
- Envirument Tab > Add new variable “TZ” with your local time zone ignore this if you want to use the default UTC
- Apply, Next, Done and your container should be ready.
Start Grafana
- Open http://YOUR_LOCAL_NAS_IP:3003 and login with the default username “root” and password “root”
- You need to import the dashboard. To do this, go to http://YOUR_LOCAL_NAS_IP:3003/dashboard/import and put “14590” in “Import via grafana.com” input
- click on load and complete the process
Enable Logging
- Install Log center From Synslogy package center
- Open Log center app
- click on Log Sending > check “Send log to syslog server”
- Set Server = “localhost”, port = “5144”, Protocol = “UDP”, Format = “BSD (RFC 3164)”
- For testing, click on “Send test log”
- Apply
Data source config
Collector type:
Collector plugins:
Collector config:
Revisions
Upload an updated version of an exported dashboard.json file from Grafana
| Revision | Description | Created | |
|---|---|---|---|
| Download |
Get this dashboard
Import the dashboard template
or
ID