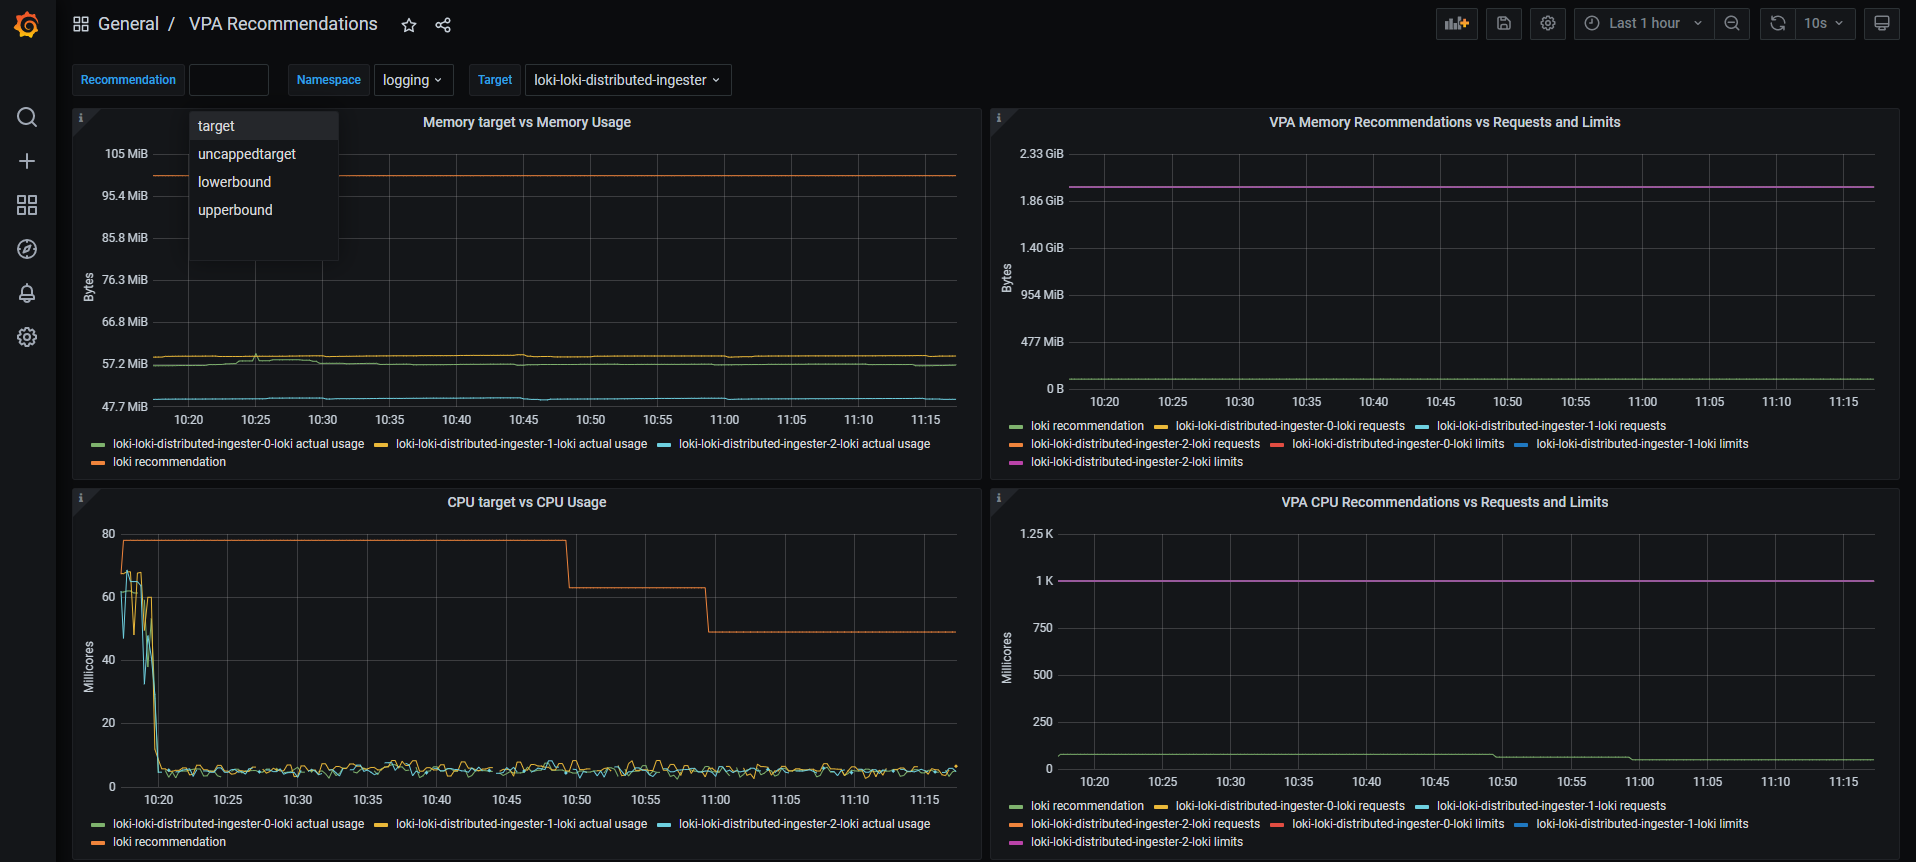
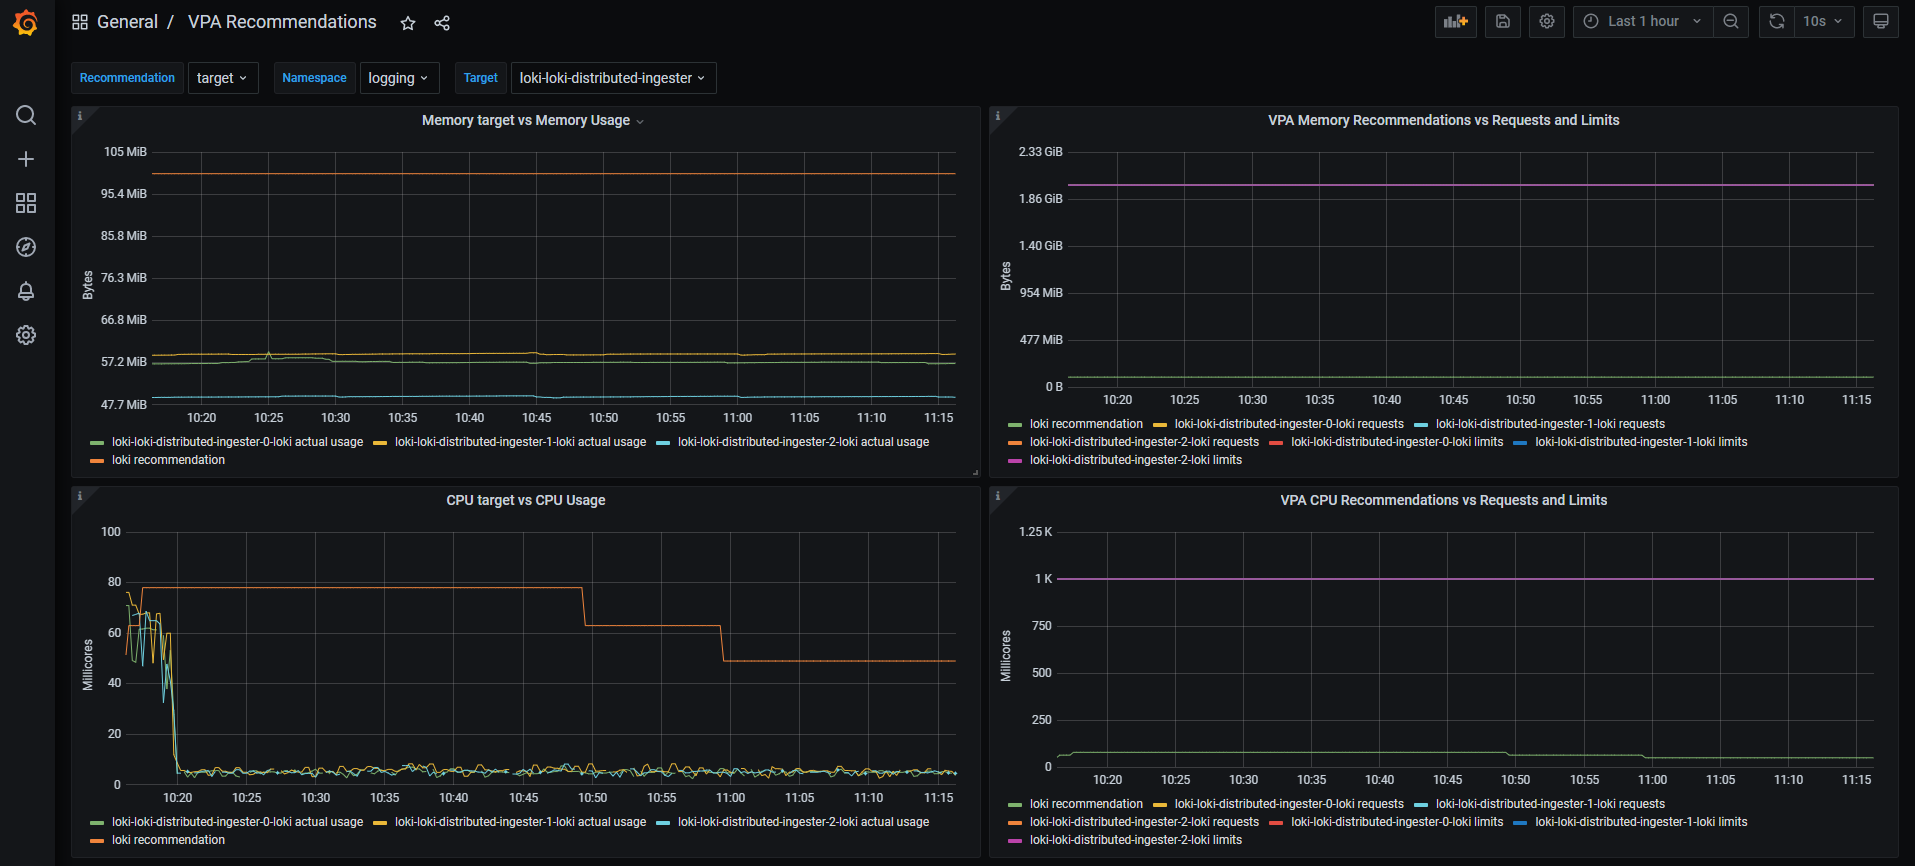
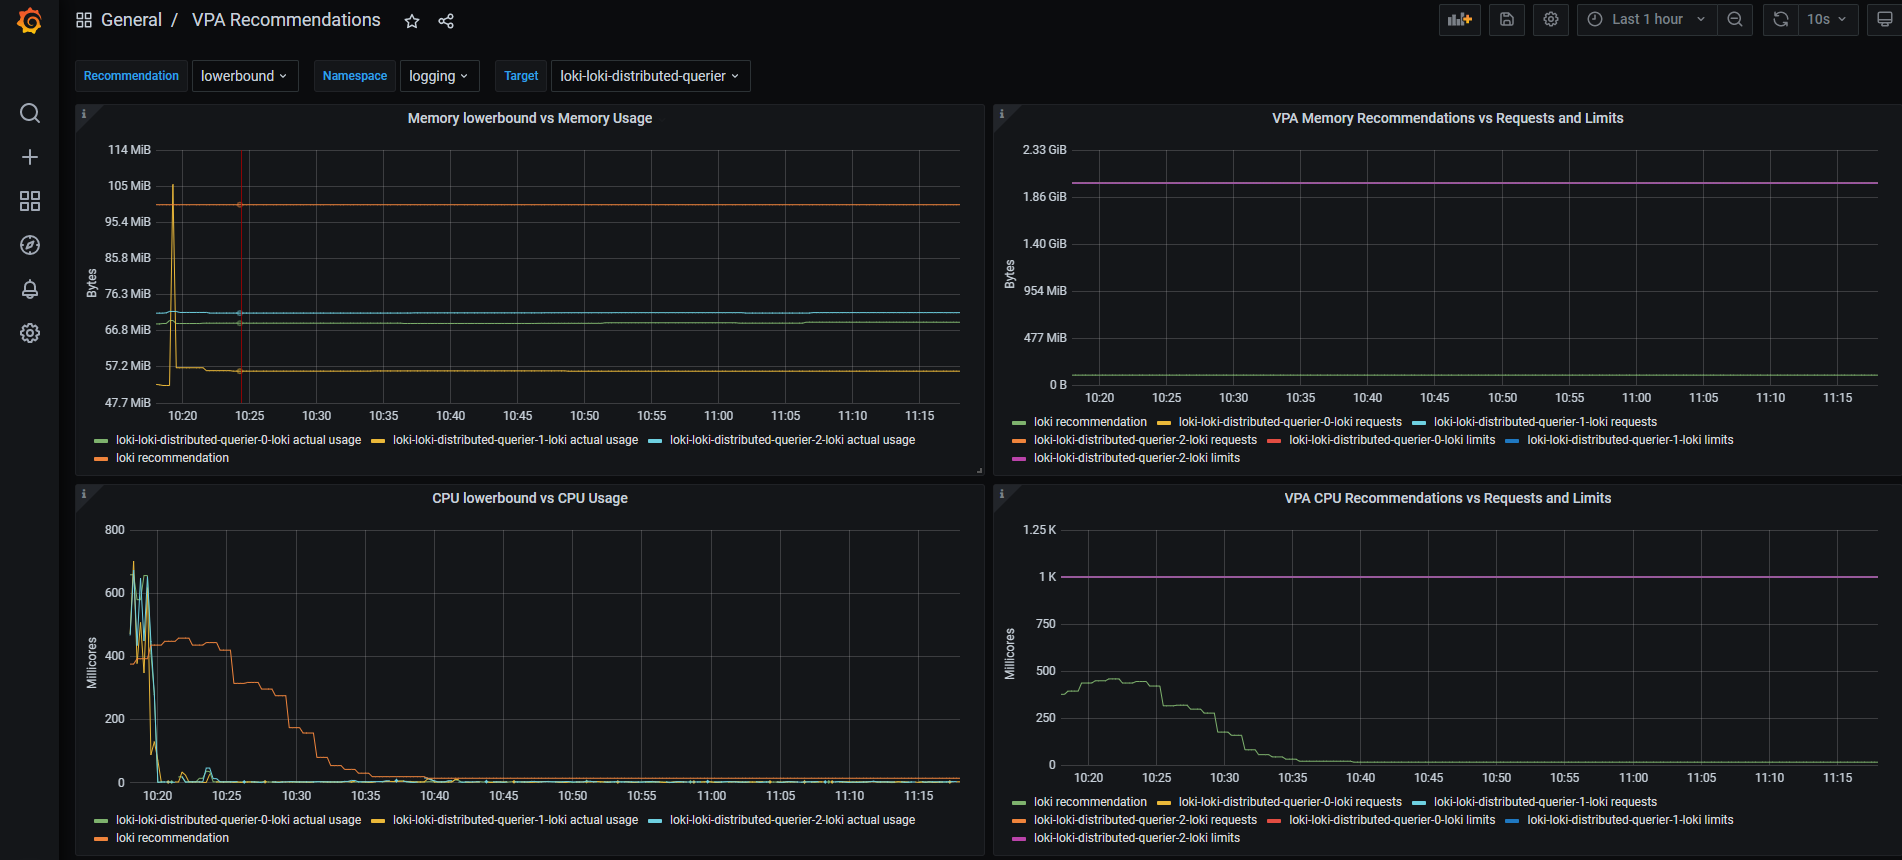
VPA Recommendations
A dashboard to visualize metrics about the Vertical Pod Autoscalar (https://github.com/kubernetes/autoscaler/tree/master/vertical-pod-autoscaler) using the generated Prometheus metrics of the Kube-State-Metrics (https://github.com/kubernetes/kube-state-metrics/blob/master/docs/verticalpodautoscaler-metrics.md)
What's it all about?
A dashboard to visualize metrics about the Vertical Pod Autoscalar (https://github.com/kubernetes/autoscaler/tree/master/vertical-pod-autoscaler) using the generated Prometheus metrics of the Kube-State-Metrics (https://github.com/kubernetes/kube-state-metrics/blob/master/docs/verticalpodautoscaler-metrics.md)
What do I need as a perquisite?
- Prometheus installed => ultimately using the kube-prometheus stack (https://github.com/prometheus-community/helm-charts/tree/main/charts/kube-prometheus-stack)
- VPA Installed and at least one
VerticalPodAutoscalarCRD is configured against a certain target (check the documentation of the VPA for more info) - Optionally: VPA is using Prometheus as a historical query backend to monitor changes over time.
- The kube-state-metrics MUST be configured to enable Vertical Pod Autoscalar metrics. Example for the Helm Chart above:
kube-state-metrics:
  rbac:
    extraRules:
      - apiGroups: ["autoscaling.k8s.io"]
        resources: ["verticalpodautoscalers"]
        verbs: ["list", "watch"]
  prometheus:
    monitor:
      enabled: true
  # https://github.com/kubernetes/kube-state-metrics/blob/main/docs/customresourcestate-metrics.md#verticalpodautoscaler
  # https://github.com/kubernetes/kube-state-metrics/issues/2041#issuecomment-1614327806
  customResourceState:
    enabled: true
    config:
      kind: CustomResourceStateMetrics
      spec:
        resources:
          - groupVersionKind:
              group: autoscaling.k8s.io
              kind: "VerticalPodAutoscaler"
              version: "v1"
            labelsFromPath:
              verticalpodautoscaler: [metadata, name]
              namespace: [metadata, namespace]
              target_api_version: [apiVersion]
              target_kind: [spec, targetRef, kind]
              target_name: [spec, targetRef, name]
            metrics:
              - name: "vpa_containerrecommendations_target"
                help: "VPA container recommendations for memory."
                each:
                  type: Gauge
                  gauge:
                    path: [status, recommendation, containerRecommendations]
                    valueFrom: [target, memory]
                    labelsFromPath:
                      container: [containerName]
                commonLabels:
                  resource: "memory"
                  unit: "byte"
              - name: "vpa_containerrecommendations_target"
                help: "VPA container recommendations for cpu."
                each:
                  type: Gauge
                  gauge:
                    path: [status, recommendation, containerRecommendations]
                    valueFrom: [target, cpu]
                    labelsFromPath:
                      container: [containerName]
                commonLabels:
                  resource: "cpu"
                  unit: "core"
  selfMonitor:
    enabled: true
My installation & configurations for the VPA
I am using the Helm chart at https://github.com/FairwindsOps/charts/tree/master/stable/vpa for the installing the VPA. There are other ways to do so. Just thought of sharing my values.yml for customizing this chart as the Prometheus part wasn't that trivial. You can check my GitHub Gist here https://gist.github.com/sherifkayad/1b4e4df408e1be357168a38e1980b9a5
What's New
- Revision 5 => (Bug fix for Revision 4 + New feature) support for Kube State Metrics v2.9.x (the deprecation of the OOTB metrics of VPA)
- Revision 3 => (New feature) added support for dynamic datasource and for multi-cluster setups (cluster label)
Data source config
Collector config:
Upload an updated version of an exported dashboard.json file from Grafana
| Revision | Description | Created | |
|---|---|---|---|
| Download |