
Nvidia GPU Metrics
Nvidia GPU Metrics based on the prometheus metrics from github.com/utkuozdemir/nvidia_gpu_exporter
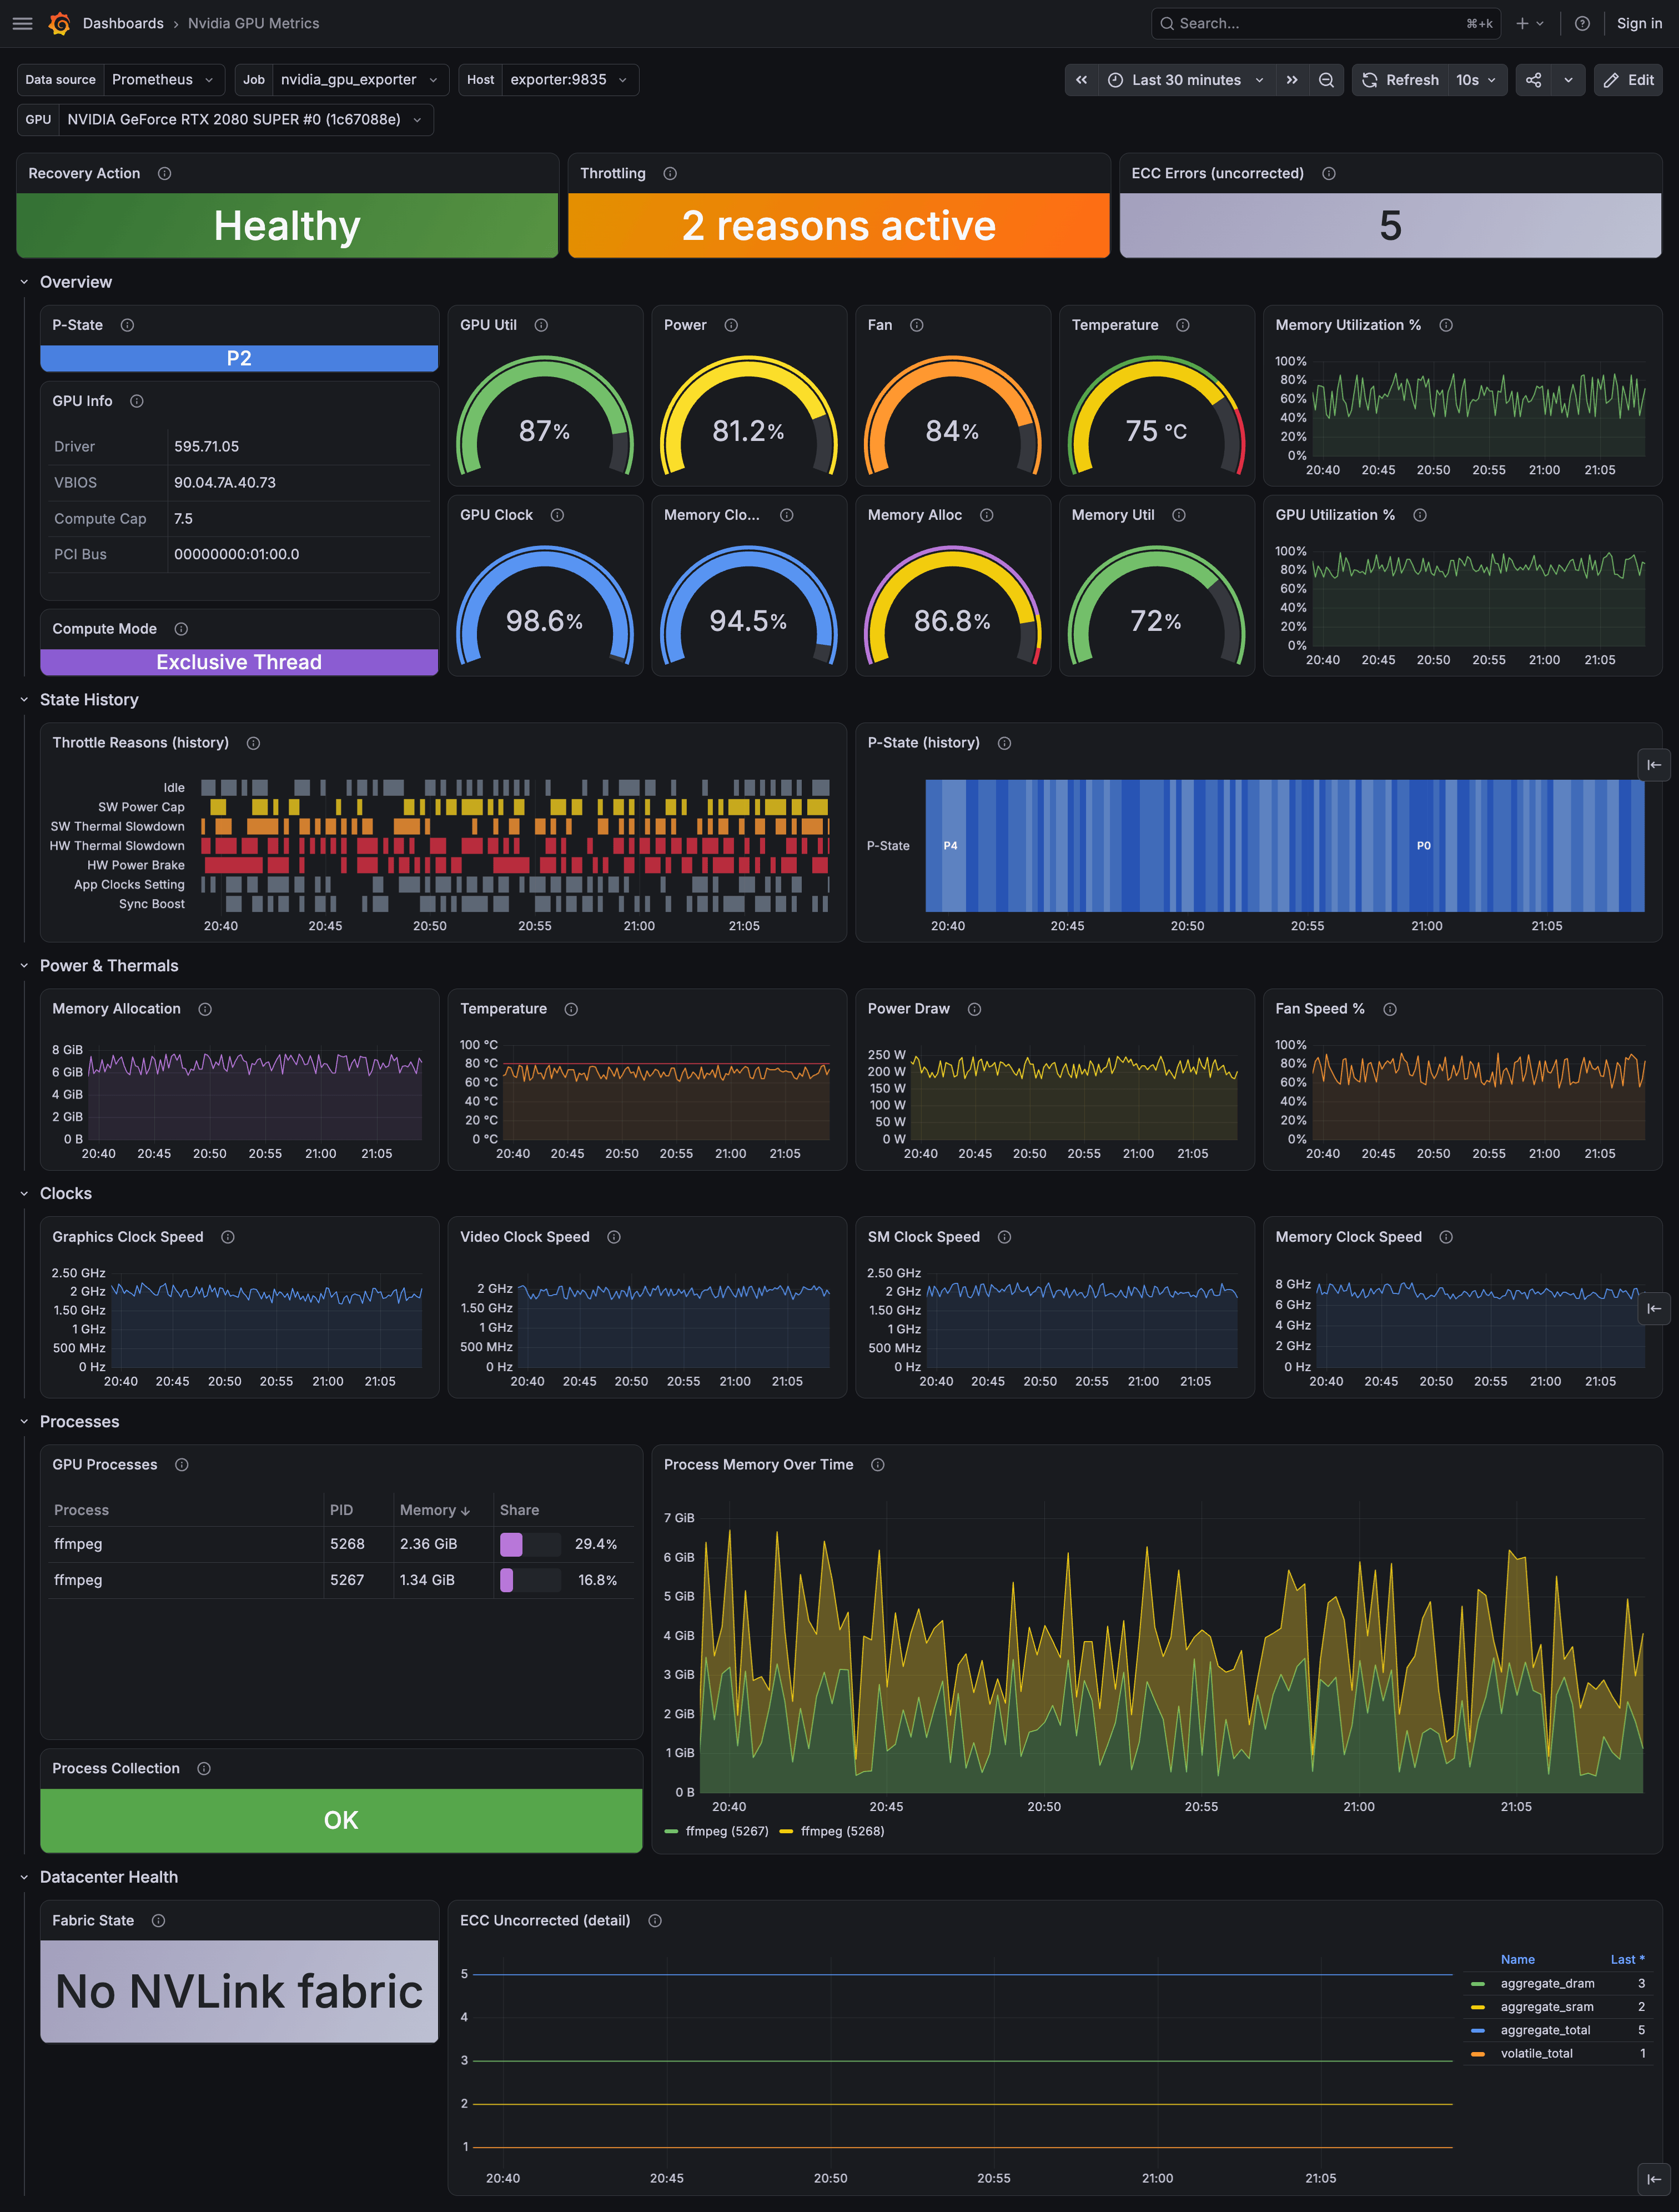
A detailed view of a single GPU, using metrics from utkuozdemir/nvidia_gpu_exporter. It works the same whether that GPU sits in a Windows gaming rig or a Linux server in a datacenter.
It shows health banners (recovery action, throttling, ECC errors), utilization and memory gauges, throttle reason and P-state history, power and thermals, clock speeds, per-process GPU memory, and NVLink fabric state. Panels for metrics your GPU does not report show that plainly instead of pretending everything is fine.
Pick the Prometheus datasource, job, host, and GPU from the dropdowns at the top.
For machines with more than one GPU there is a companion Nvidia GPU Overview dashboard that compares all GPUs of a node side by side. Its rows drill down into this dashboard.
Requires Grafana 11.2 or newer.
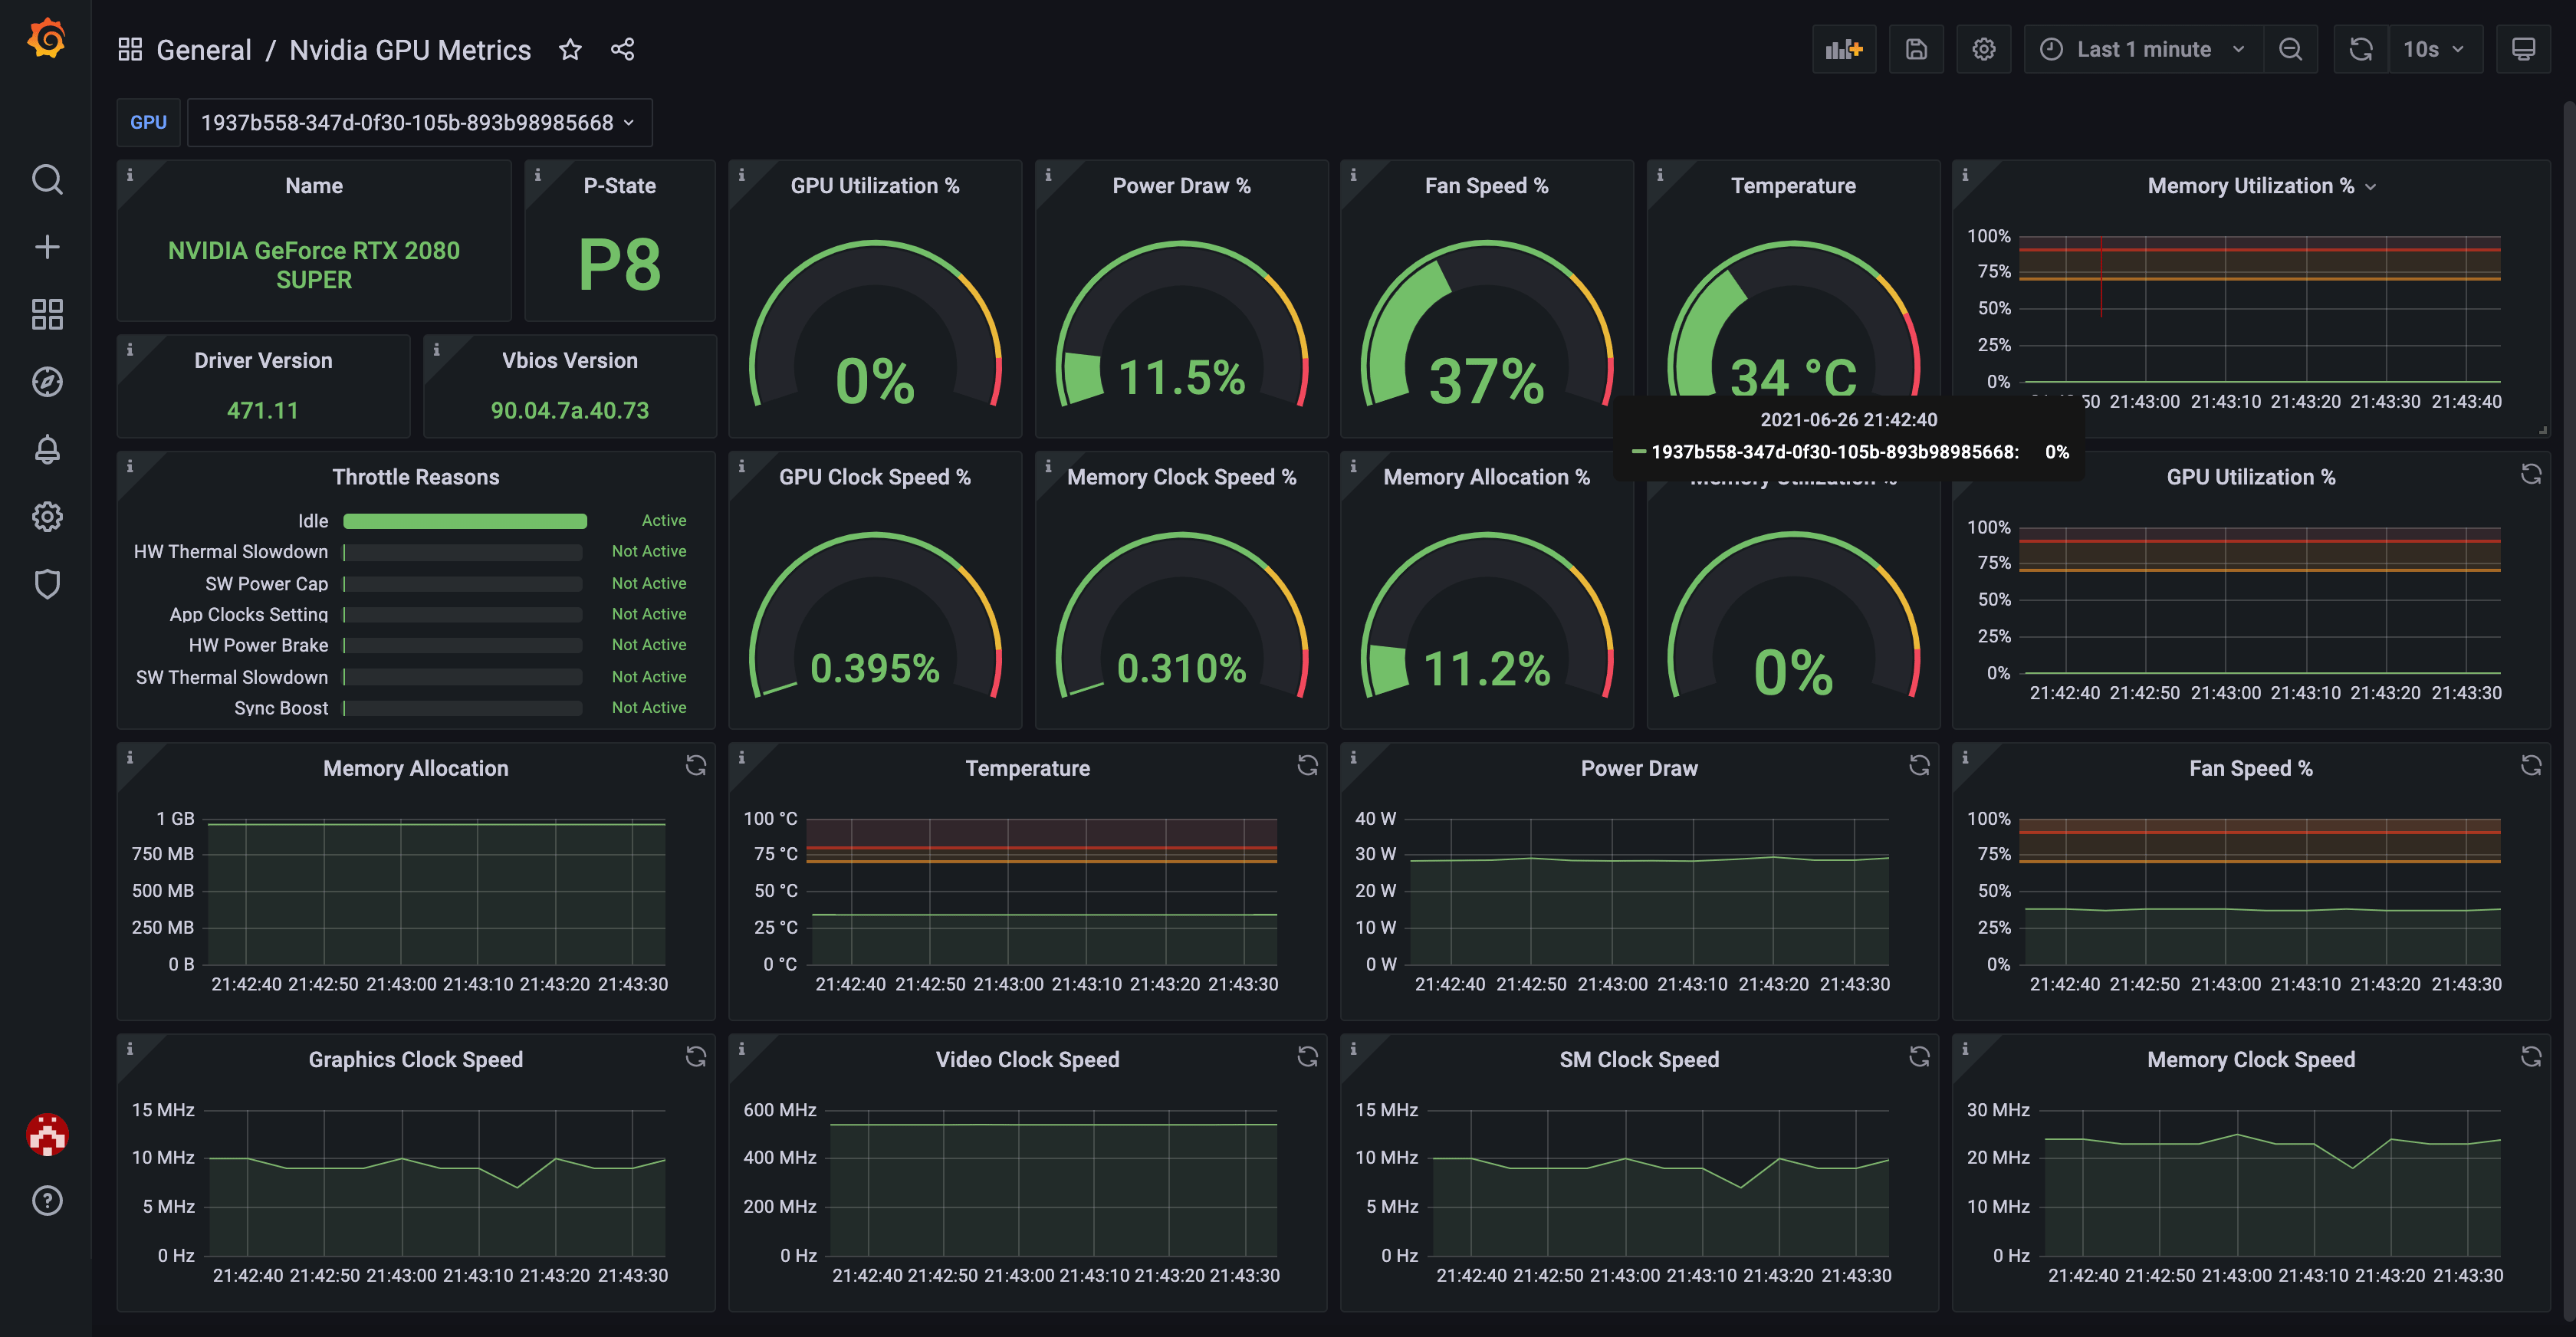
Data source config
Collector config:
Upload an updated version of an exported dashboard.json file from Grafana
| Revision | Description | Created | |
|---|---|---|---|
| Download |