GitHub Organization
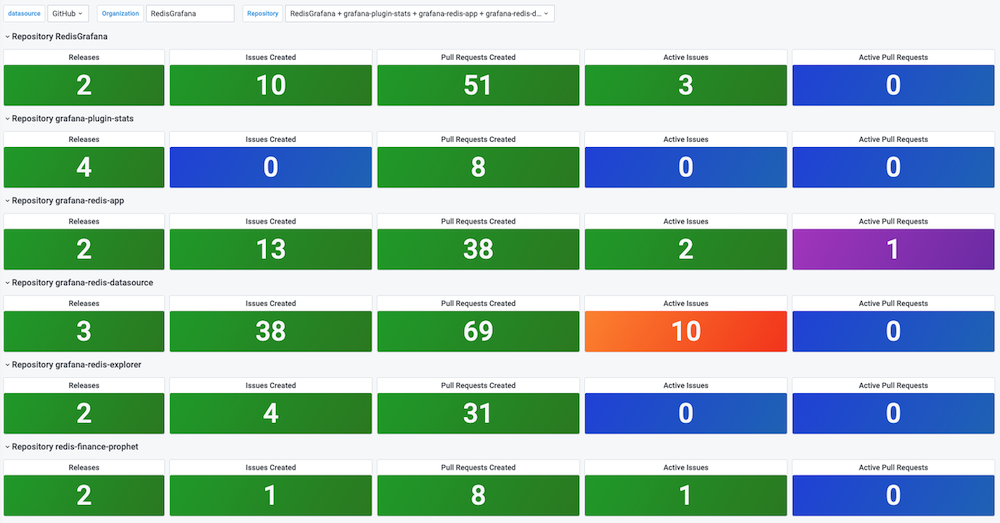
This dashboard contains PR and Issues across multiple repositories in the Organization using GitHub data source.
This dashboard provides PR and Issues across multiple repositories in the Organization using GitHub data source:
- Releases (0 marked blue as inactive, 1+ marked green as active)
- Issues Created (0 marked blue as inactive, 1+ marked green as active)
- Pull Requests Created (0 marked blue as inactive, 1+ marked green as active)
- Active Issues (0 marked blue as inactive, 1-9 marked green as active, 10+ marked orange as requiring attention)
- Active Pull Requests (0 marked blue as inactive, 1+ marked purple as active)
Thresholds are suitable for small organizations and should be adjusted for specific project needs.
Read more about the plugin on the Grafana blog.
Data source config
Collector config:
Upload an updated version of an exported dashboard.json file from Grafana
| Revision | Description | Created | |
|---|---|---|---|
| Download |
GitHub
Easily monitor GitHub, a service for software development and version control using Git, with Grafana Cloud's out-of-the-box monitoring solution.
Learn more
