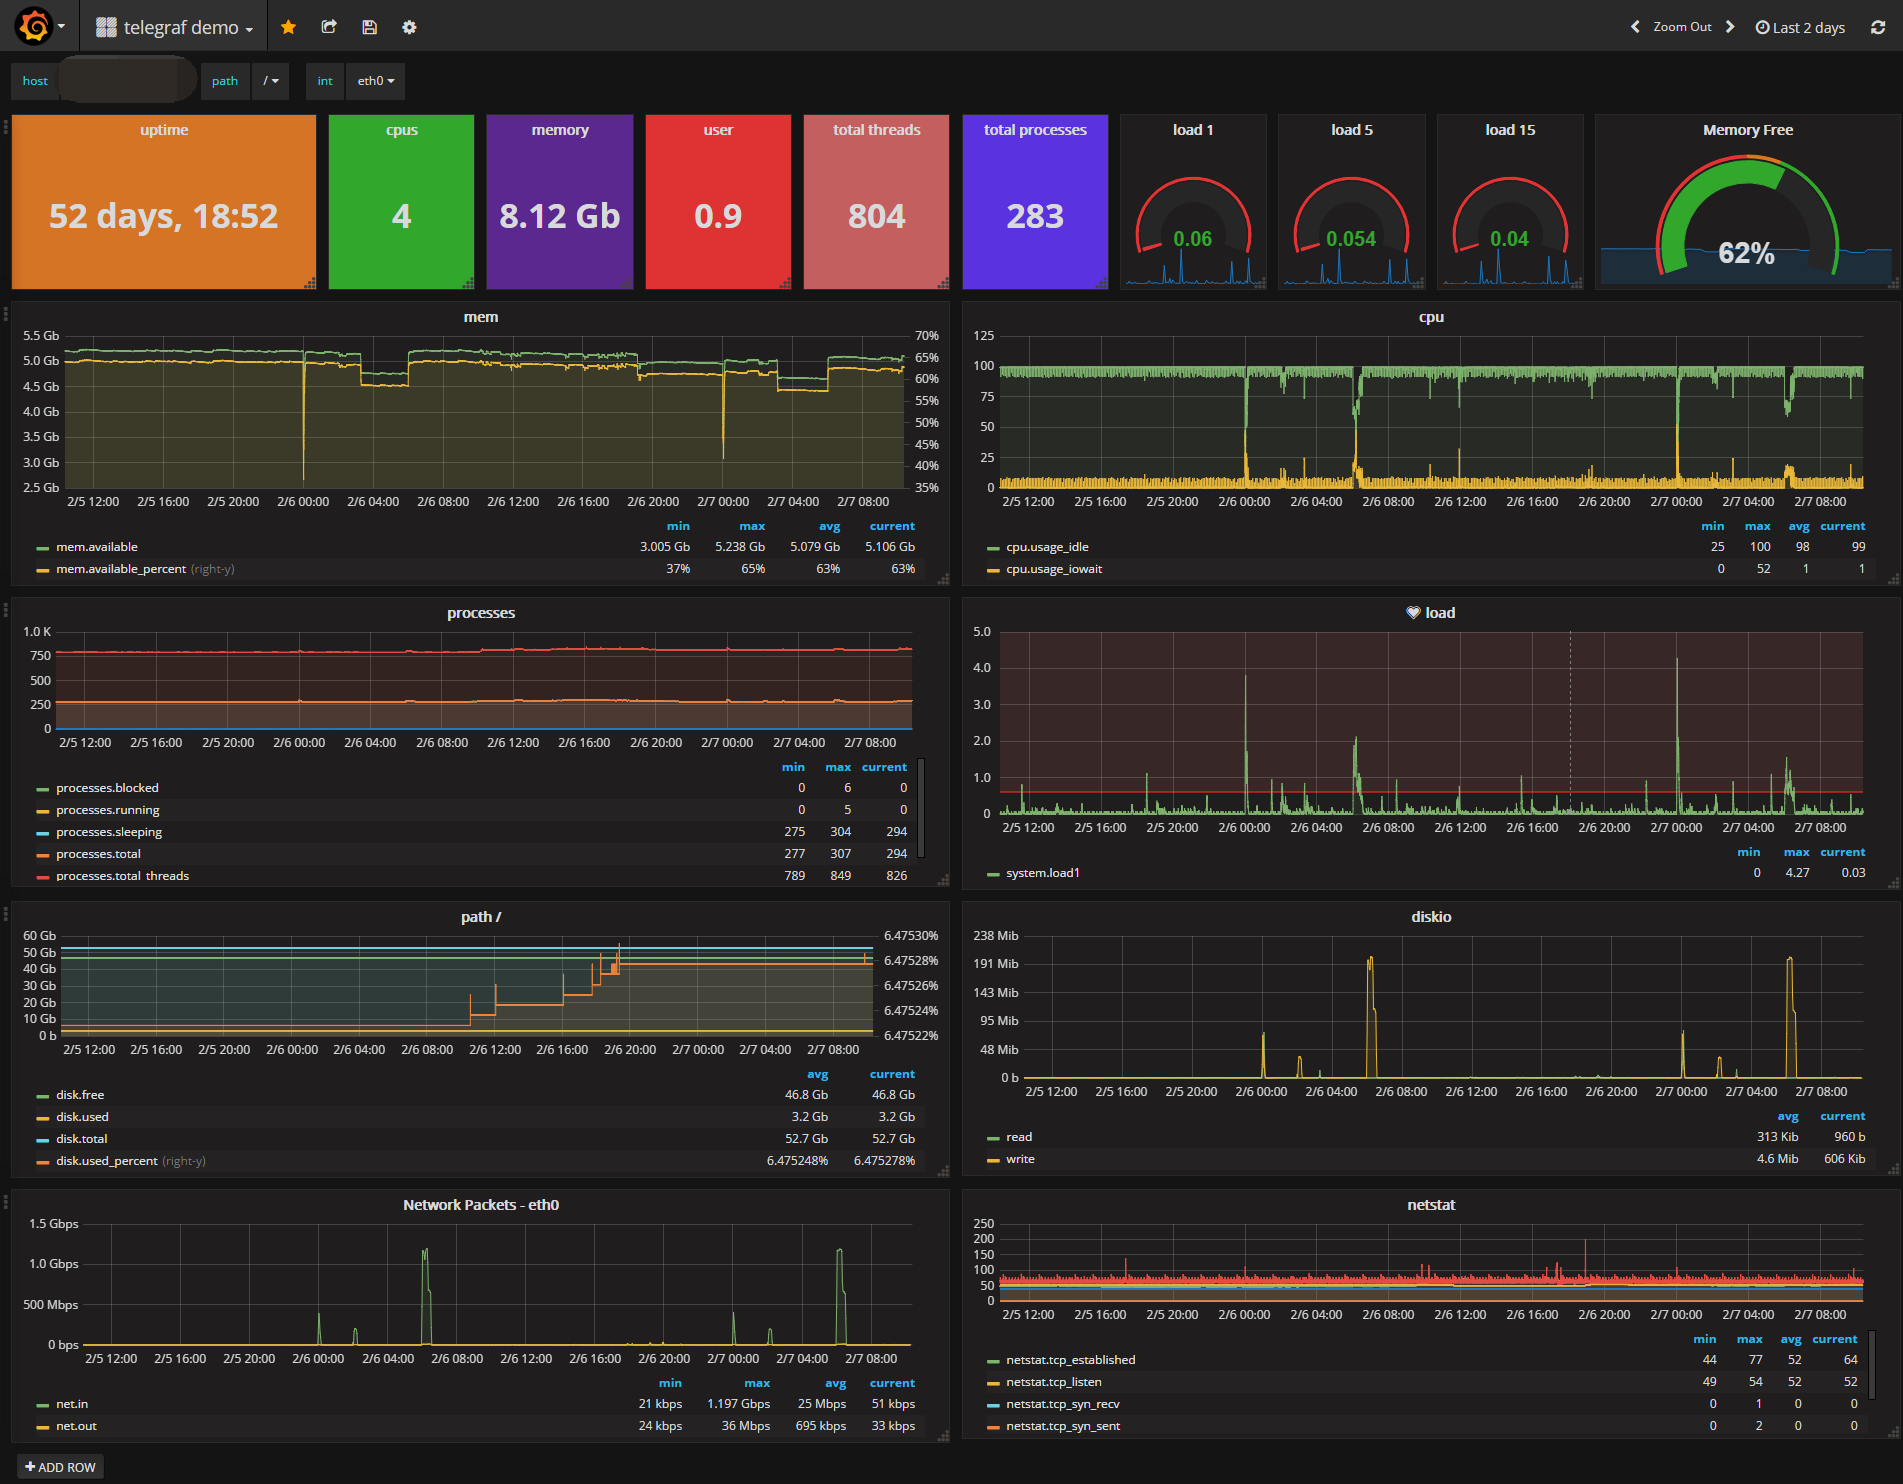
Grafana telegraf demo_看图王.png
Blog
http://www.vincentblog.cn/
344166929#qq.com
Collector Configuration Details
[[inputs.net]]
# ## By default, telegraf gathers stats from any up interface (excluding loopback)
# ## Setting interfaces will tell it to gather these explicit interfaces,
# ## regardless of status.
# ##
interfaces = ["eth0,eth1,lo"]
[[inputs.cpu]]
## Whether to report per-cpu stats or not
percpu = true
## Whether to report total system cpu stats or not
totalcpu = true
## If true, collect raw CPU time metrics.
collect_cpu_time = false
# Read metrics about disk usage by mount point
[[inputs.disk]]
## By default, telegraf gather stats for all mountpoints.
## Setting mountpoints will restrict the stats to the specified mountpoints.
# mount_points = ["/"]
## Ignore some mountpoints by filesystem type. For example (dev)tmpfs (usually
## present on /run, /var/run, /dev/shm or /dev).
ignore_fs = ["tmpfs", "devtmpfs"]
# Read metrics about disk IO by device
[[inputs.diskio]]
## By default, telegraf will gather stats for all devices including
## disk partitions.
## Setting devices will restrict the stats to the specified devices.
# devices = ["sda", "sdb"]
## Uncomment the following line if you need disk serial numbers.
# skip_serial_number = false
# Get kernel statistics from /proc/stat
[[inputs.kernel]]
# no configuration
# Read metrics about memory usage
[[inputs.mem]]
# no configuration
# Get the number of processes and group them by status
[[inputs.processes]]
# no configuration
# Read metrics about swap memory usage
[[inputs.swap]]
[[inputs.system]]
[[inputs.netstat]]