
Grafana Agent Node Exporter Quickstart
A quickstart to setup Prometheus Node Exporter with preconfigured dashboards, alerting rules, and recording rules.
To use this dashboard, please follow Grafana Agent Docs to monitor your Linux nodes by setting up Node Exporter integration for Grafana Agent with preconfigured dashboards, alerting rules, and recording rules.
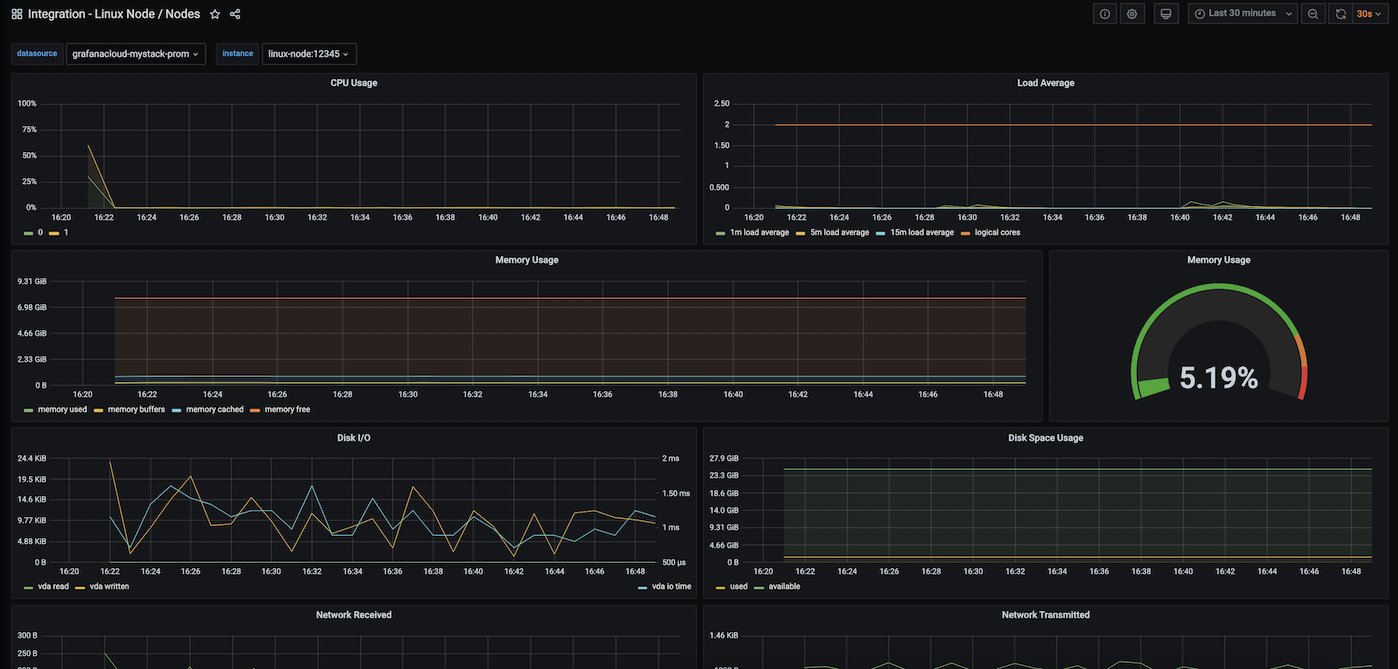
This dashboard includes panels for the following metrics:
- CPU Usage
- Load Average
- Memory Usage
- Disk I/O
- Disk Usage
- Network Received
- Network Transmitted
This dashboard is adapted from the original Node Exporter Quickstart. It uses the job=integrations/node_exporter selector to query metrics.
Data source config
Collector type:
Collector plugins:
Collector config:
Revisions
Upload an updated version of an exported dashboard.json file from Grafana
| Revision | Description | Created | |
|---|---|---|---|
| Download |
Grafana Agent
Easily monitor metrics and logs from a Grafana Agent instance with Grafana Cloud's out-of-the-box monitoring solution.
Learn more