Grafana Dashboard for NetApp ONTAP v9.8+
Grafana Dashboard for NetApp ONTAP v9.8+
Just download the latest NetApp ONTAP script version from GitHub https://raw.githubusercontent.com/jorgedlcruz/netapp_ontap-grafana/main/netapp_ontap.sh and change the Configuration section within your details:
##
# Configurations
##
netappInfluxDBURL="http://YOURINFLUXSERVERIP" #Your InfluxDB Server, http://FQDN or https://FQDN if using SSL
netappInfluxDBPort="8086" #Default Port
netappInfluxDB="telegraf" #Default Database
netappInfluxDBUser="USER" #User for Database
netappInfluxDBPassword='PASSWORD' #Password for Database
Endpoint URL for login action
netappUsername="YOURONTAPUSER" #Your username with privileges to login into the ONTAP
netappPassword='YOURONTAPPASSWORD'
netappAuth=$(echo -ne "$netappUsername:$netappPassword" | base64);
netappRestServer="YOURONTAPSERVER"
netappMetrics="20" #They came in interval of 15 seconds, so 20 will be equal to the metrics of the last 5 minutes. If you want to run your script every 5 minutes, let it like this, if not, change it accordingly.
Once the changes are done, make the script executable with chmod:
chmod +x netapp_ontap.sh
The output of the command should be something like the next, without errors:
Writing netapp_cluster_metrics to InfluxDB
HTTP/1.1 204 No Content
Content-Type: application/json
Request-Id: c5a36e57-95a5-11eb-a1dd-0050569017a8
X-Influxdb-Build: OSS
X-Influxdb-Version: 1.8.4
X-Request-Id: c5a36e57-95a5-11eb-a1dd-0050569017a8
Date: Mon, 05 Apr 2021 00:27:58 GMT
Writing netapp_cluster_metrics to InfluxDB
HTTP/1.1 204 No Content
Content-Type: application/json
Request-Id: c5eab0fa-95a5-11eb-a1de-0050569017a8
X-Influxdb-Build: OSS
X-Influxdb-Version: 1.8.4
X-Request-Id: c5eab0fa-95a5-11eb-a1de-0050569017a8
Date: Mon, 05 Apr 2021 00:27:58 GMT
If so, please now add this script to your crontab, like for example every 5 minutes:
*/5 * * * * * /home/oper/netapp_ontap.sh >> /var/log/netapp.log 2>&1
Check now that you can see all the new data on your Chronograf, or Grafana Explorer.
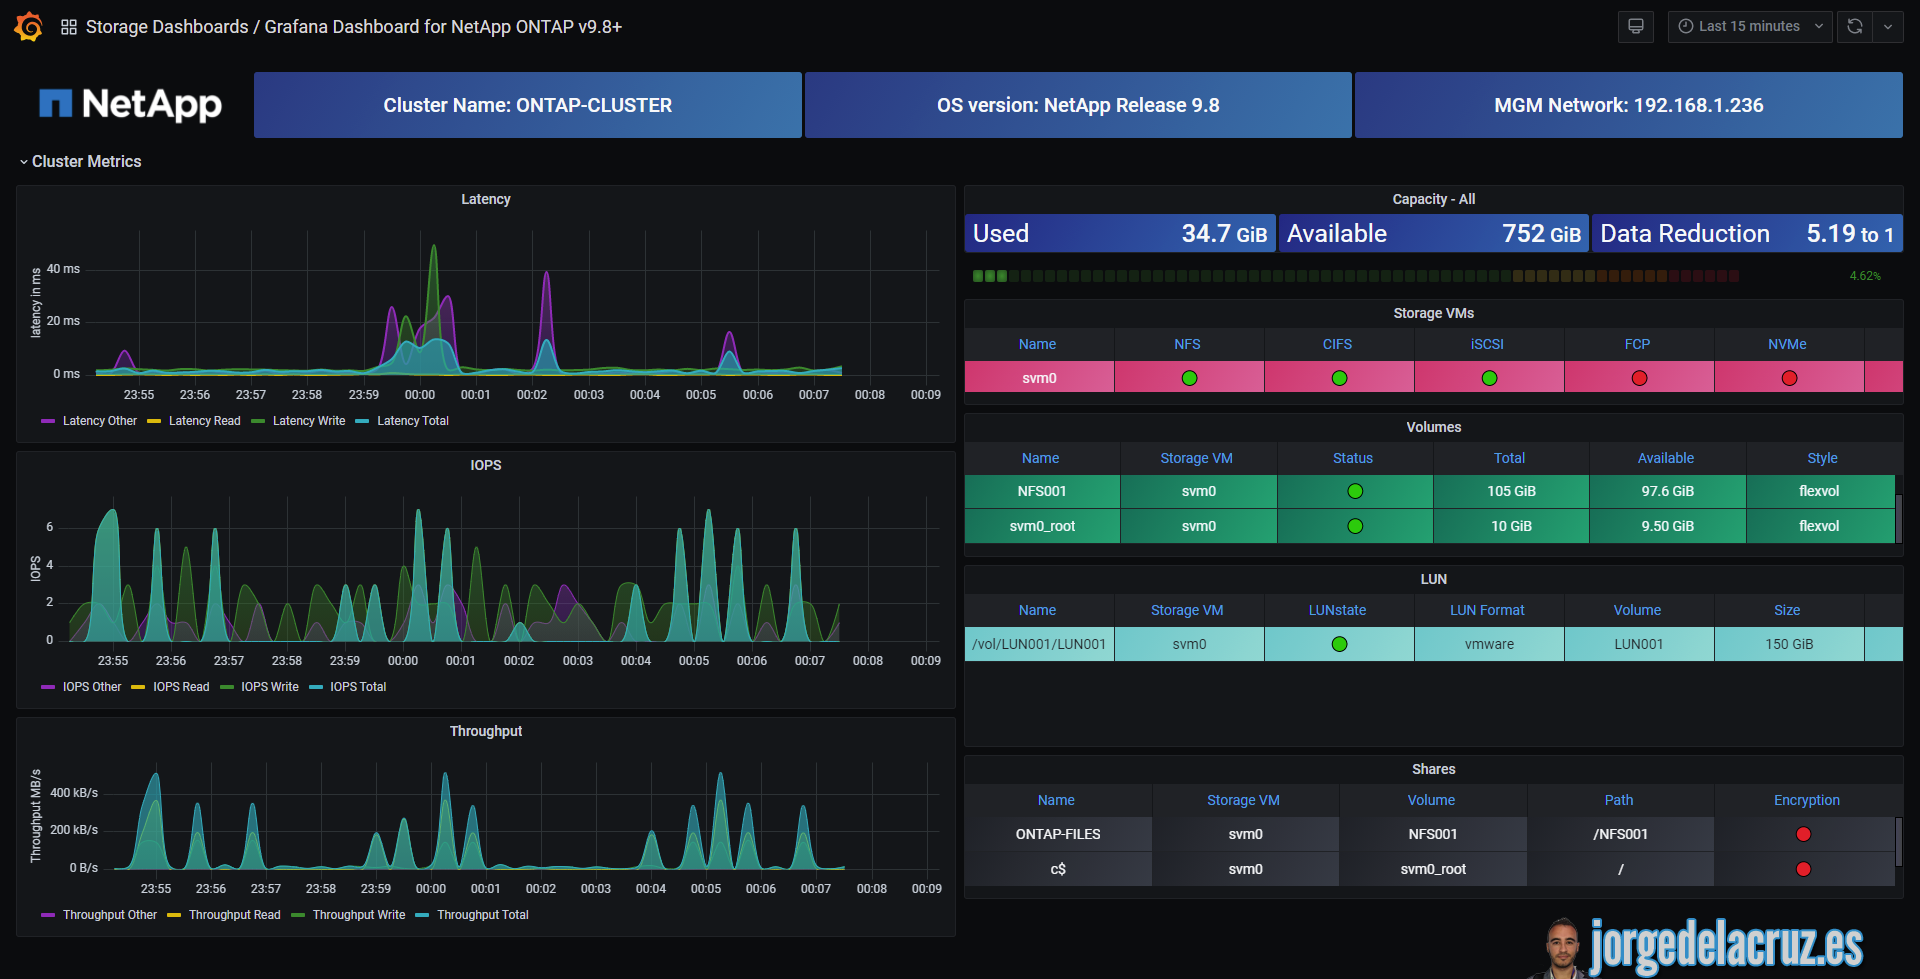
Then download or import this Dashboard to your Grafana, and you should see something similar to the next:

Data source config
Collector config:
Upload an updated version of an exported dashboard.json file from Grafana
| Revision | Description | Created | |
|---|---|---|---|
| Download |