WebSphere Application Server PMI Metrics Dashboard
Visualize PMI metrics data for your WebSphere Application Server
Revision 3: Included support for cell labels. This functionality has been introduced in 8.5.5.20 and 9.0.5.9
Starting in WebSphere Application Server 9.0.5.7 and 8.5.5.20 the IBM WebSphere team introduced a new capability where the statistical MBean data gathered by Performance Monitoring Infrastructure (PMI) is collected to produce metrics in Prometheus exposition format. This new capability allows the WebSphere Application Server topology to be monitored effectively using Prometheus and Grafana.
This capability is also currently available as an Interim Fix for WebSphere Application Server 8.5.5.16-8.5.5.19. See PH24409: Prometheus endpoint for Performance Monitoring Infrastructure (PMI) metrics on Websphere Application Server traditional for more information.
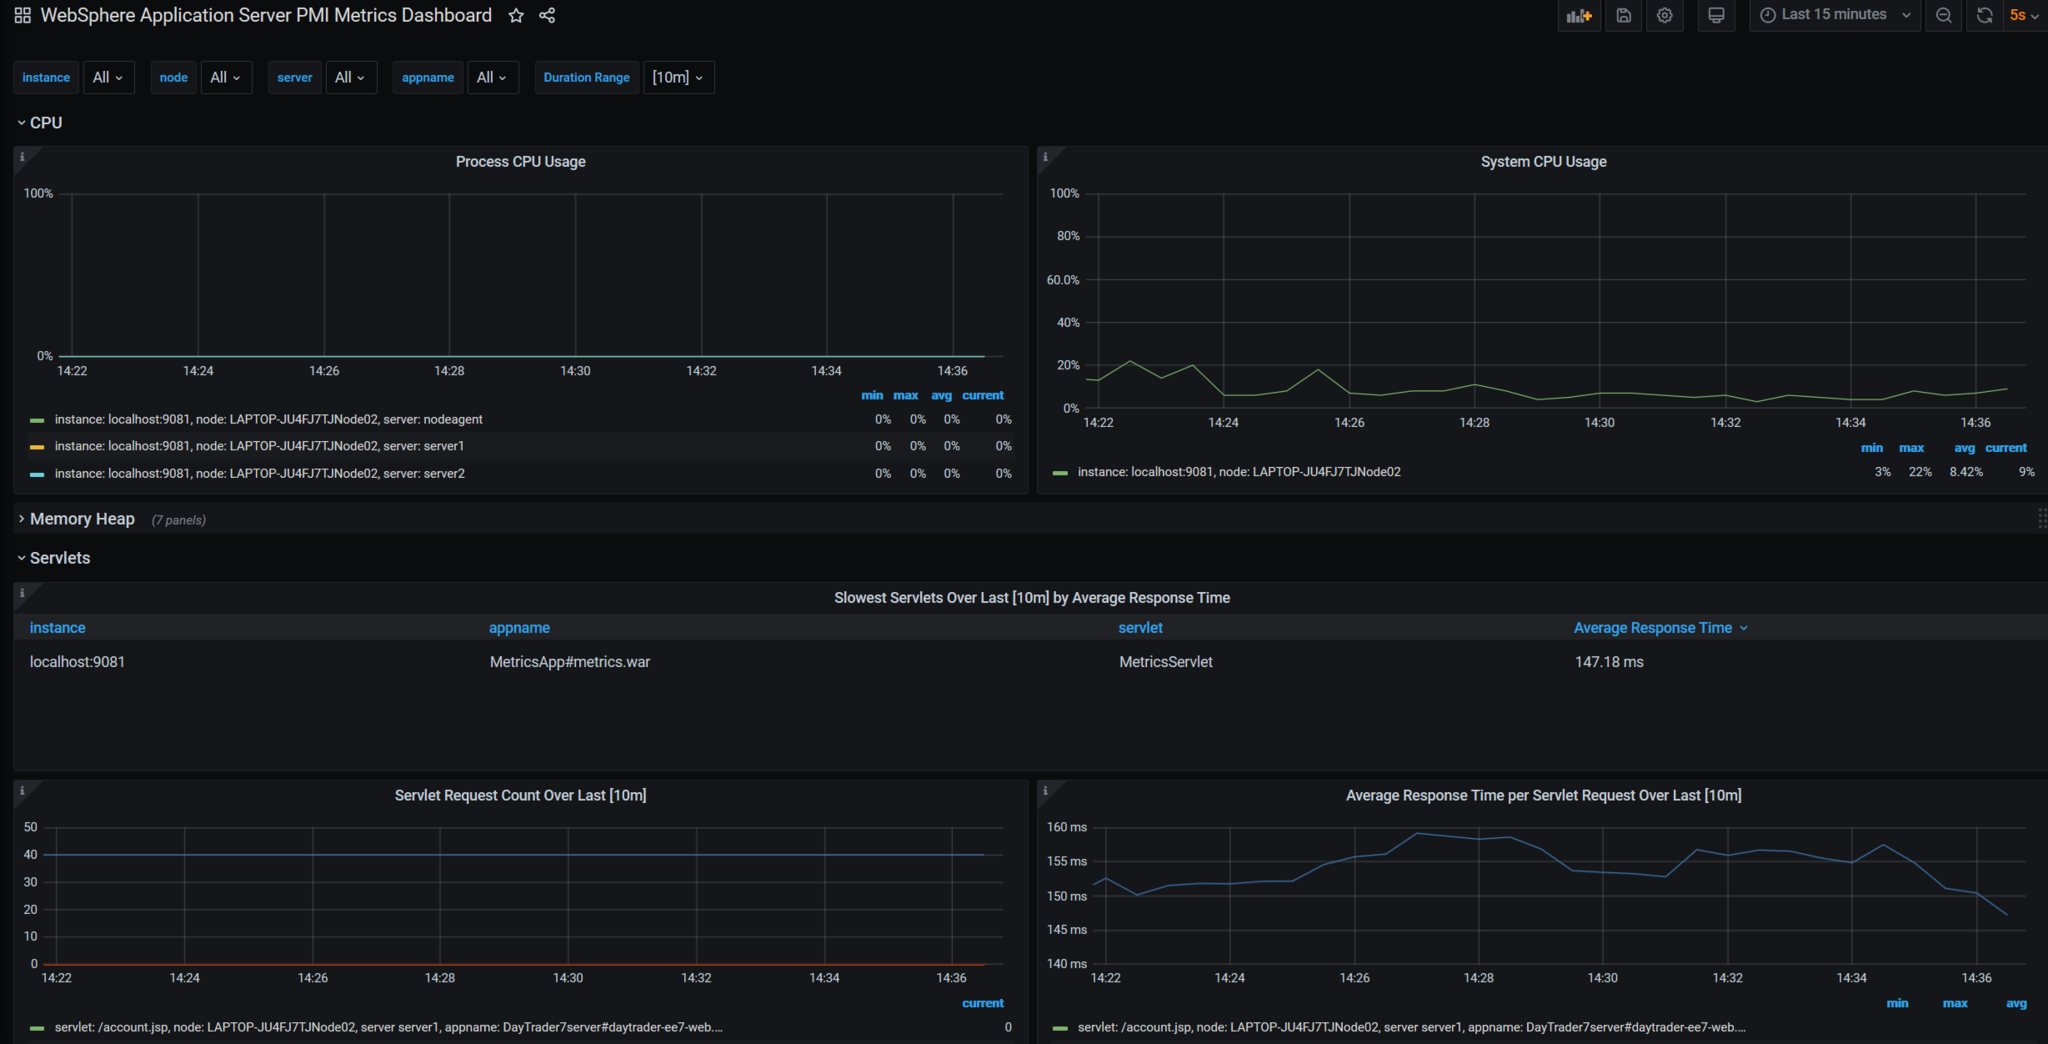
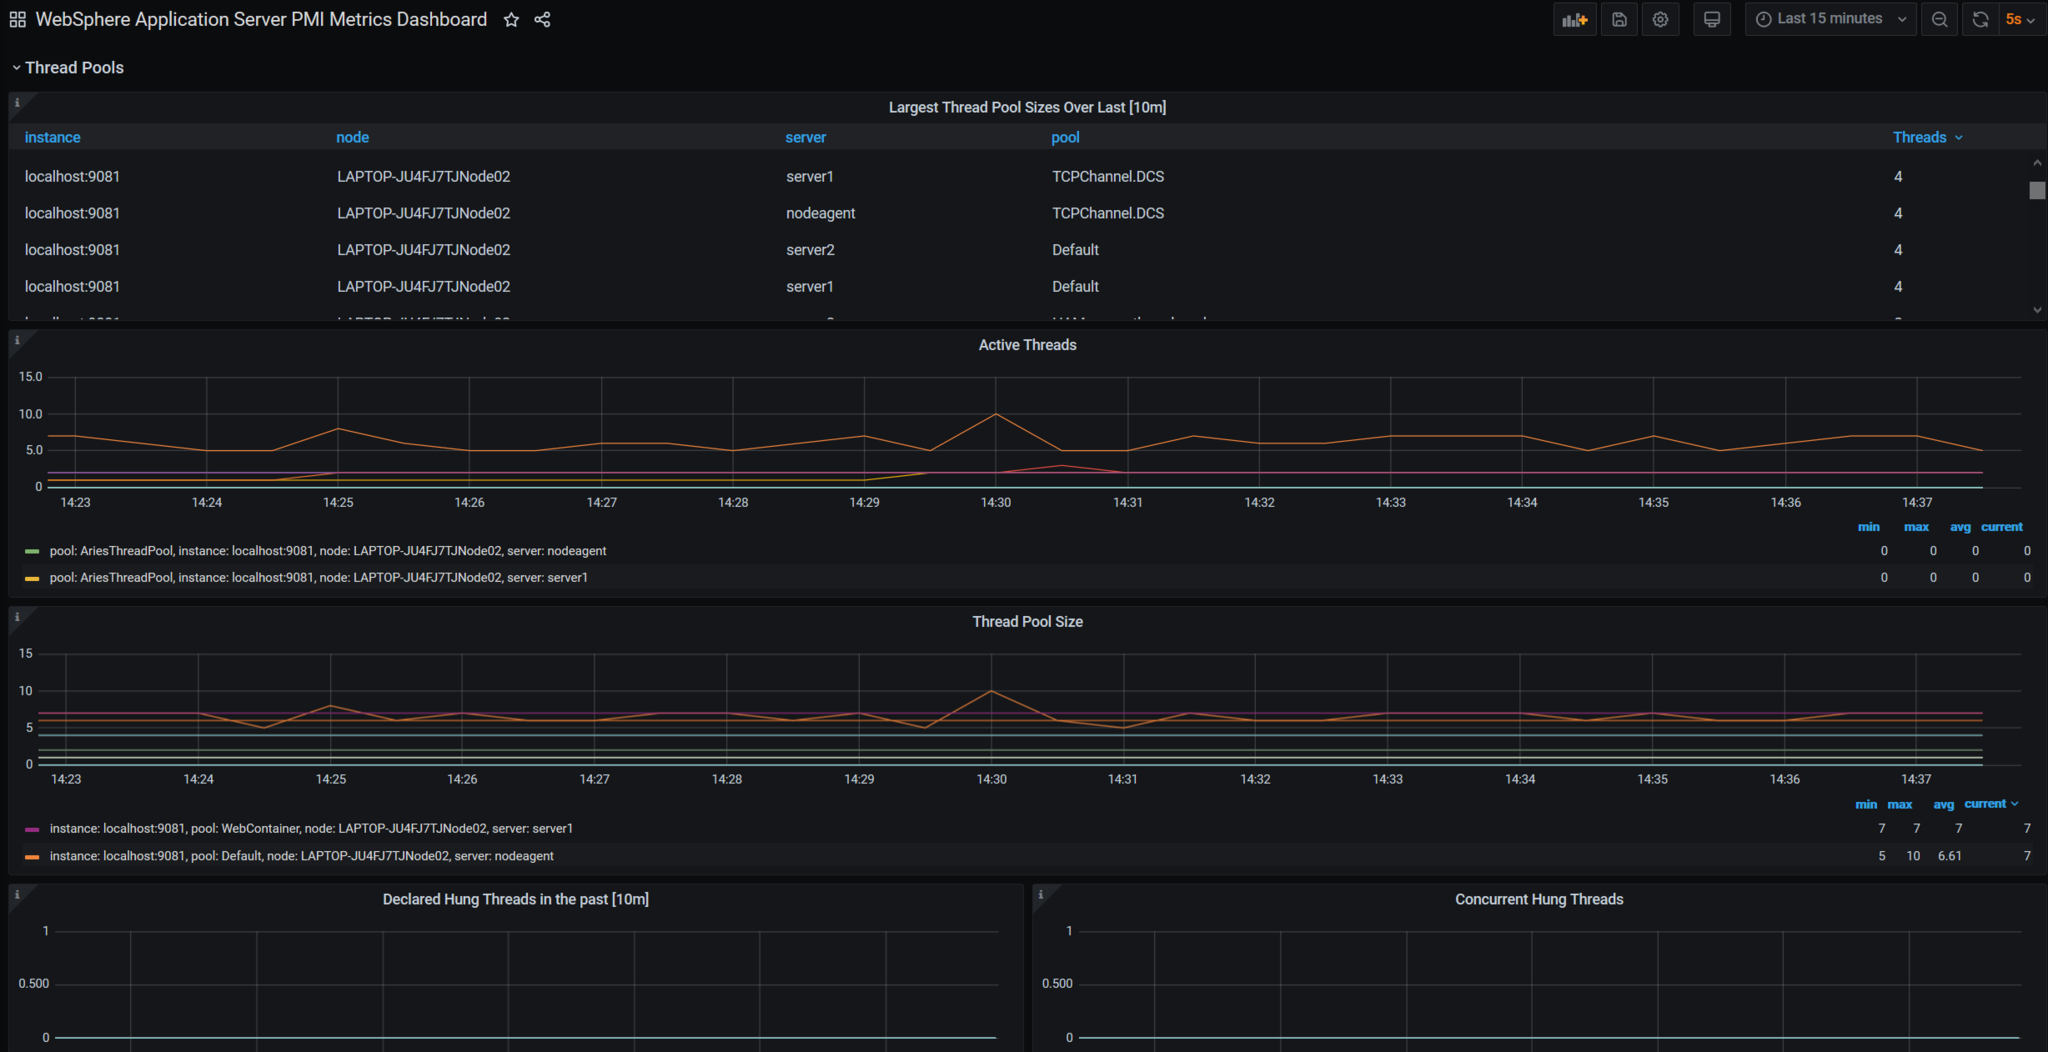
This dashboard leverages the Prometheus formatted metric data to visualize CPU, Memory Heap, Servlets, EJBs, Connection Pool, SIB, Sessions, Threadpool, Garbage Collection, and other JVM metrics of the entire cell. This dashboard has been tested with Grafana 7.3.x and 7.4.x.
## WebSphere Application Server:
- Install the metrics.ear found in the <WAS_installation_directory>/installableApps directory onto your application server
- Enable the desired PMI setting for your servers or use the wsadmin script provided below to enable the exact PMI stats/metrics that the Grafana dashboard uses.
- Learn more about the WebSphere Performance Monitoring Infrastructure
- See the full list of Prometheus Metrics
Prometheus
Configure the scrape_configs section of prometheus.yml in one of the following ways:
For metrics on an insecure endpoint (i.e. application security is not enabled):
  - job_name: 'wasCell01'
    scrape_interval: 15s
    static_configs:
      - targets: ['localhost:9080']
For metrics on an secure endpoint using basic authentication (i.e. application security is enabled):
  - job_name: 'wasCell01-secure'
    scrape_interval: 15s
    static_configs:
      - targets: ['localhost:9443']
    basic_auth:
      username: "<your-username>"
      password: "<your-password>"
    tls_config:
      insecure_skip_verify: true
    scheme: "https"
Wsadmin Script to configure the exact PMI stats
Provided below is a Jython script that that will iterate through all your servers and enable the exact PMI stats needed by this Grafana dashboard.
There are a few steps required to run this script:
- Find your deployment manager's node name by copying the node name value in the <Deployment_Manager_Profile_Directory>/logs/AboutThisProfile.txt file
- Create the Jython script under <Deployment_Manager_Profile_Directory>/bin/ and name it
setPMI.jy - Run the script by invoking :
./wsadmin.sh -f setPMI.jy -lang jython - When prompted, enter the node name from step 1.
- When the "done" message appears on the terminal, the script has finished configuring the servers in your cell.
Wsadmin script:
# -*- coding: utf-8 -*-
def main():
    #Enables all specified attributes
    #can be found in <dmgr_home>/logs/AboutThisProfile.txt under Node Name
    mgrName = raw_input("Please enter name of Cell Manager (can be found in <dmgr_home>/logs/AboutThisProfile.txt under Node Name): ")
    customString = [append(), java.lang.Boolean ('true')]
    #Goes through each node
    for node in AdminConfig.list('Node').split():
        nName = AdminConfig.showAttribute(node, 'name')
        #Makes sure to not include the cell manager nodes
        if nName.find(mgrName) < 0:
            for server in AdminControl.queryNames("type=Server,node="+ nName + ",").split():
                #This obtains the Performance Mbean object.
                #First it gets the MBean name (i.e perfStr)
                #SEcond it obtains the Mbean Object (I.e perfObj)
                processName = AdminControl.getAttribute(server, 'name')
                perfStr = AdminControl.queryNames("type=Perf,process=" + processName + ",node=" + nName + ",")
                perfObj = AdminControl.makeObjectName(perfStr)
                print("initializing:" + processName + ". From: " + nName)
                init(perfStr, perfObj)
                print("configuring:" + processName + ". From: " + nName)
                invoke(perfStr, perfObj, customString)
                print("done")
#Below is how you would ENABLE or DISABLE specific PMI stats/attributes.
#The attribute IDs/Numbers are derived from: https://www.ibm.com/support/knowledgecenter/en/SSAW57_9.0.5/com.ibm.websphere.nd.multiplatform.doc/ae/rprf_datacounter14.html
def append():
    string ='servletSessionsModule=6,1,2,7'
    string+=':beanModule=11,12'
    string+=':webAppModule=11,13'
    string+=':threadPoolModule=3,8,6,4,7'
    string+=':StatGroup.SIBService=8,14'
    string+=':StatGroup.SIBService>StatGroup.Communications>StatGroup.Clients>StatGroup.ClientsStandard=563,562'
    string+=':StatGroup.SIBService>StatGroup.Communications>StatGroup.MessagingEngines>StatGroup.MessagingEnginesStandard='
    string+=':StatGroup.SIBService>StatGroup.SIBMessagingEngines=513,512'
    string+=':j2cModule=2,15,1,6,14,12,13,7'
    string+=':connectionPoolModule=2,15,1,6,14,12,13,7'
    string+=':jvmRuntimeModule='
    string+=':jvmRuntimeModule>GC='
    string+=':jvmRuntimeModule>Monitor='
    string+=':jvmRuntimeModule>Object='
    string+=':jvmRuntimeModule>Thread=*'
    return string
def invoke(perfStr, perfObj, customString):
    sigs = ['java.lang.String', 'java.lang.Boolean']
    AdminControl.invoke_jmx (perfObj, 'setCustomSetString', customString, sigs)
    AdminControl.invoke(perfStr,'savePMIConfiguration')
#initializes the configuration to 'None'
def init(perfStr, perfObj):
    sigs = ['java.lang.String']
    params = ['none']
    AdminControl.invoke_jmx (perfObj, 'setStatisticSet', params, sigs)
    AdminControl.invoke(perfStr,'savePMIConfiguration')
if name == "main":
    main()
Data source config
Collector config:
Upload an updated version of an exported dashboard.json file from Grafana
| Revision | Description | Created | |
|---|---|---|---|
| Download |