Netdata: Elasticsearch Overview
Detailed stats for Elasticsearch (status, search, indexing, etc)
About dashboard
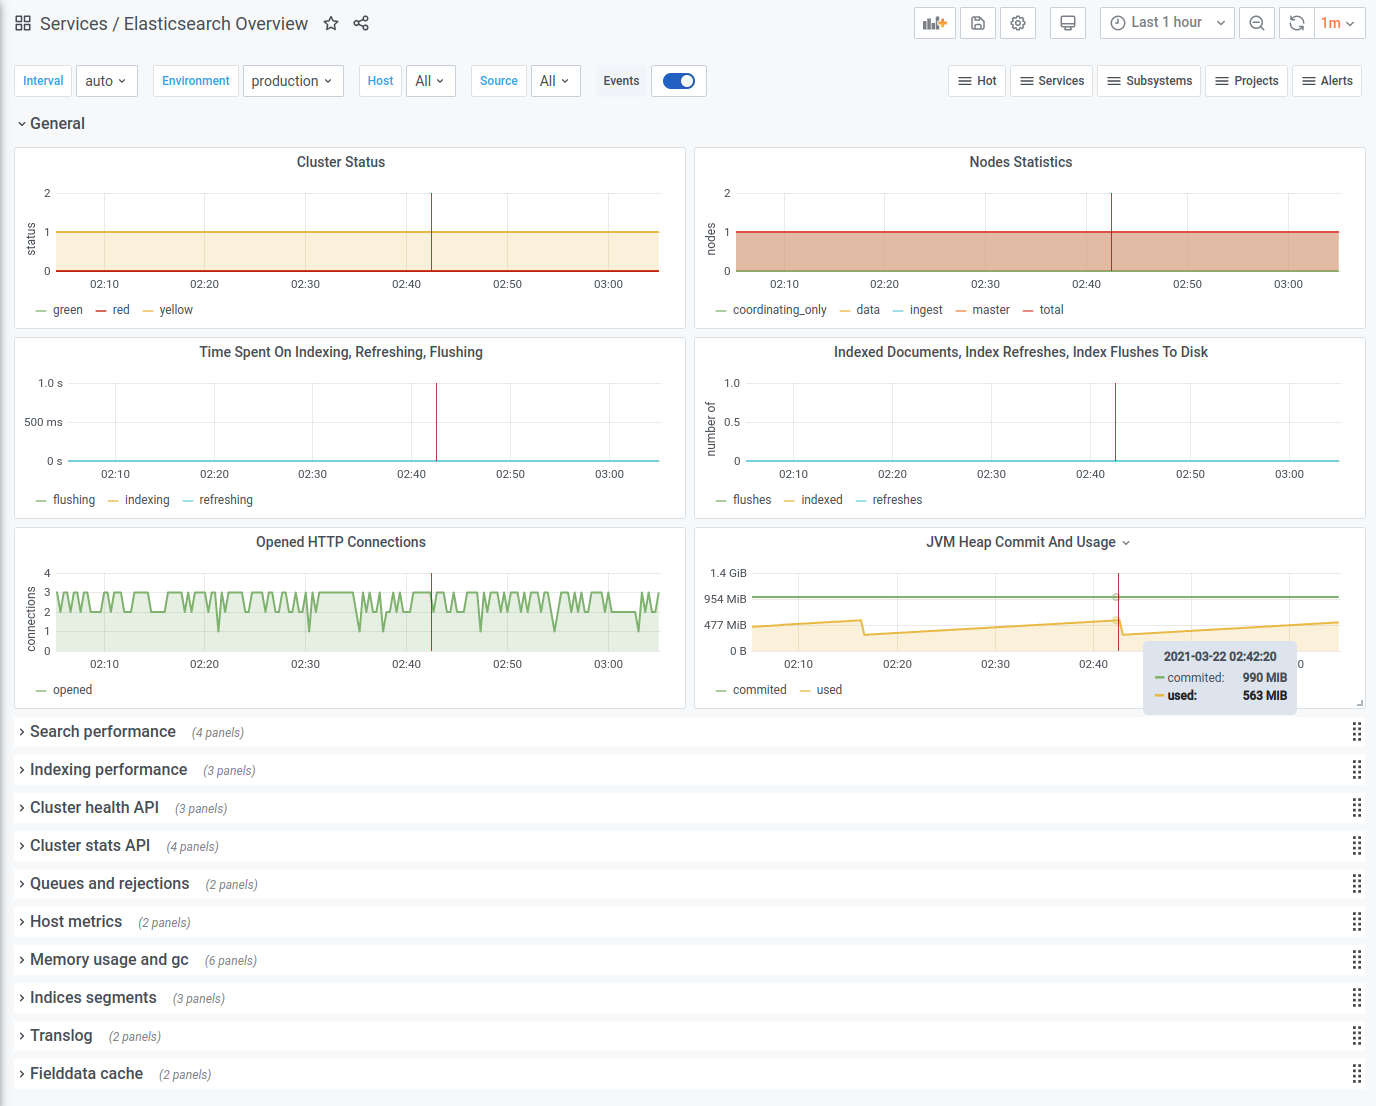
A dashboard with an overview for Elasticsearch metrics:
- Cluster status (green/yellow/red)
- Nodes Statistics (master, data, ingest, etc)
- Operations time (indexing, refreshing, flushing)
- Index Statistics (documents, refreshes, flushes)
- HTTP connections and JVM Heap usage
- Search performance (queries and fetches, time, latency)
- Indexing performance (documents, status, latency)
- Cluster health and stats API (nodes, shards, docs, cache, storage, etc)
- Queues and rejections (index, search, write)
- Host metrics (file descriptors, bandwidth)
- Memory usage and garbage collector (heap, direct buffers, mapped buffers, etc)
- Indices segments (usage by type, total)
- Translog (operations, size)
- Feilddata cache (usage, evictions)
More dashboards for Netdata you can find here.
How to use
Netdata setup
Follow these instructions to setup Elasticsearch monitoring in Netdata.
Prometheus setup
Please note that you need Netdata as an exporter for metrics. Plus, these labels are mandatory:
- job
- env
- instance
- group
- source
In your prometheus.yml it should look like this:
- job_name: netdata
  metrics_path: /api/v1/allmetrics?format=prometheus_all_hosts&source=raw
  relabel_configs:
  - source_labels: [__address__]
    regex: ^(.+)\.\w+:\d+
    target_label: instance
    action: replace
  static_configs:
  - targets: [netdata.hostname.here:19999]
    labels:
      env: production
      group: applications
      source: newproject
WARNING: Without these labels, this dashboard won't be fully functioning.
Links
License
GPL3
Author
OSSHelp Team, see https://oss.help
Data source config
Collector config:
Upload an updated version of an exported dashboard.json file from Grafana
| Revision | Description | Created | |
|---|---|---|---|
| Download |
Elasticsearch
Easily monitor Elasticsearch, a distributed, multitenant full-text search engine, with Grafana Cloud's out-of-the-box monitoring solution.
Learn more
