Node.js Exporter Quickstart and Dashboard
A quickstart to setup the Prometheus Node.js Exporter with preconfigured dashboards, alerting rules, and recording rules.
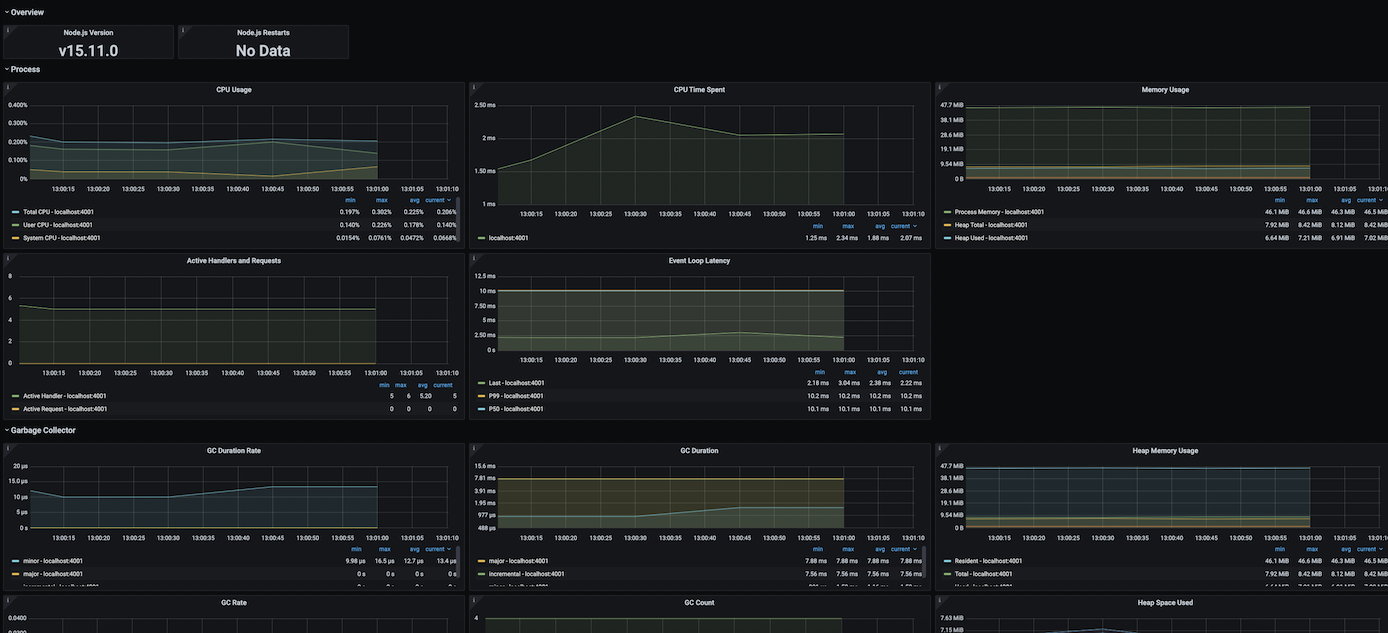
To use this dashboard, please follow the Node.js Exporter Quickstart. This quickstart helps you monitor your Node.js server by setting up prom-client for Node.js with preconfigured dashboards, alerting rules, and recording rules. This dashboard includes panels for the following metrics:
- Node.js Version
- Node.js Restarts
- CPU Usage
- CPU Time Spent
- Memory Usage
- Active Handlers and Requests
- Event Loop Latency
- GC Duration Rate
- GC Duration
- Heap Memory Usage
- GC Rate
- GC Count
- Heap Space Used
This dashboard was generated using the Node.js Exporter mixin. If you need to modify or regenerate it, please see the mixin repository.
Data source config
Collector type:
Collector plugins:
Collector config:
Revisions
Upload an updated version of an exported dashboard.json file from Grafana
| Revision | Description | Created | |
|---|---|---|---|
| Download |