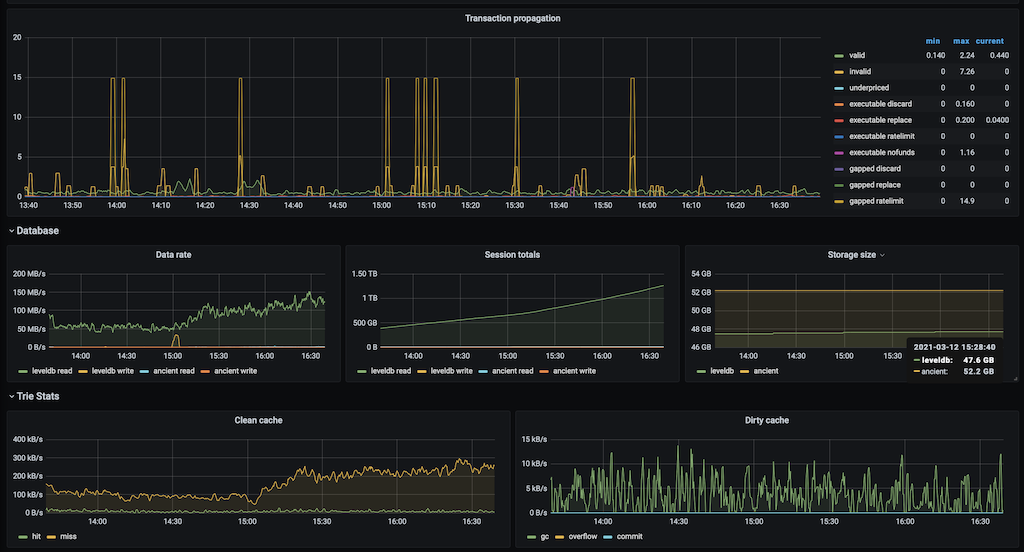
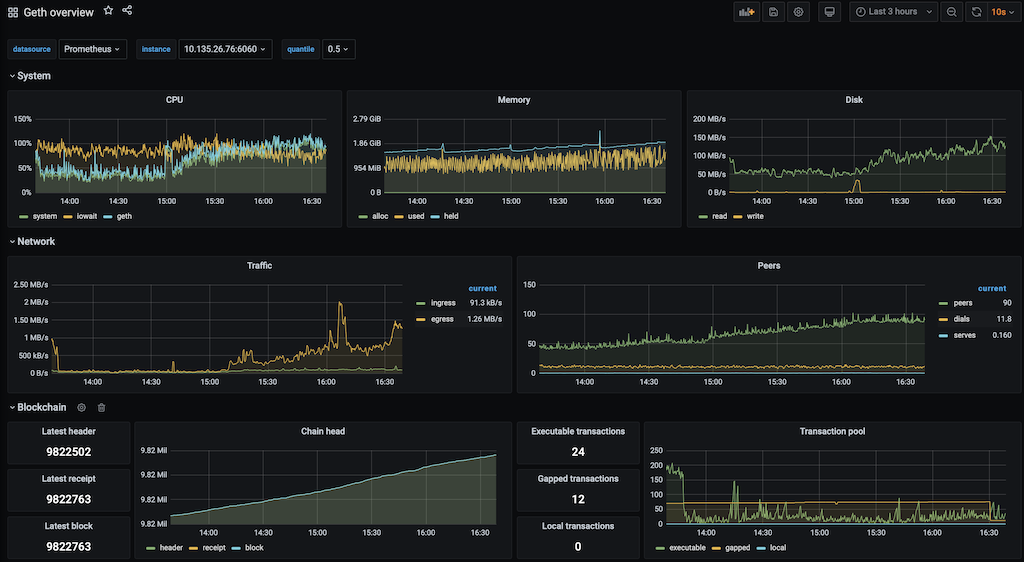
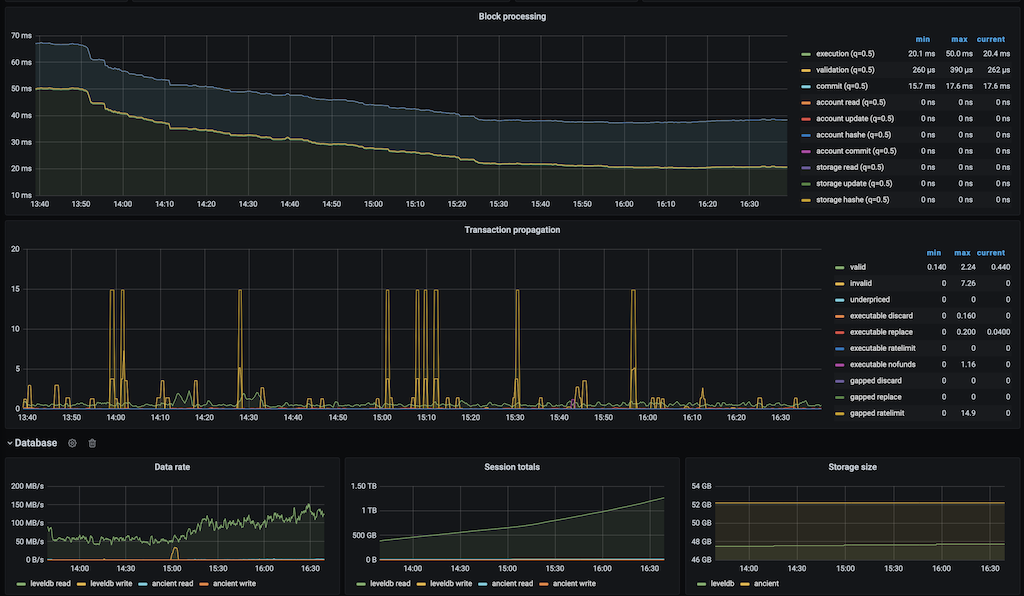
Geth overview
Geth metrics overview dashboard.
Add this args to geth (default port is 6060)
--metrics --pprof --pprof.addr=0.0.0.0
and add Prometheus scrape job:
- job_name: 'geth_node'
  metrics_path: /debug/metrics/prometheus
  static_configs:
  - targets: ['X.X.X.X:6060']
=============================
Many thanks for user hereimalive on the Reddit
I got his dashboard on the Reddit post and did some cosmetic changes. And it is here.
Also you can try my helm chart for the Geth - geth-helm
Data source config
Collector config:
Upload an updated version of an exported dashboard.json file from Grafana
| Revision | Description | Created | |
|---|---|---|---|
| Download |


