
GitHub Default
This dashboard contains a sample of some of the various features and display methods available in the GitHub datasource.
The GitHub datasource plugin is available for download here.
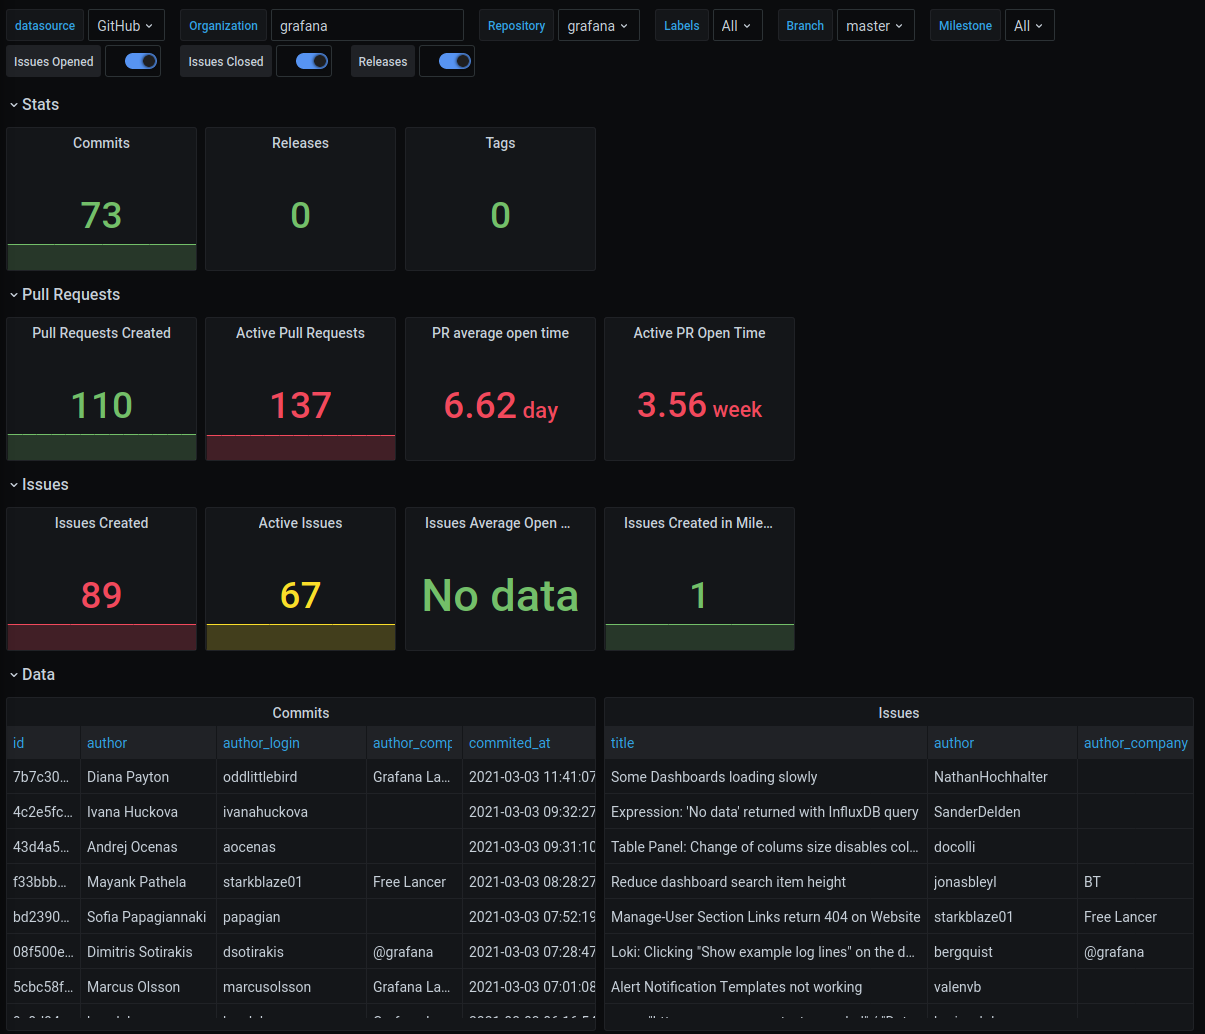
This dashboard uses a sampling of the available features in the GitHub data source to show interesting information about a given GitHub repository. A version of this dashboard is also bundled within the data source plugin.
Ensure you have a properly configured GitHub data source for it to work. By default it will read from the grafana/grafana repository but any can be used.
Read more about the plugin on the Grafana blog.
Data source config
Collector config:
Upload an updated version of an exported dashboard.json file from Grafana
| Revision | Description | Created | |
|---|---|---|---|
| Download |
GitHub
Easily monitor GitHub, a service for software development and version control using Git, with Grafana Cloud's out-of-the-box monitoring solution.
Learn more