
Home Energy Usage v2
A dashboard that shows your home energy usage. Using Prometheus, Home Assistant and the Emporia Vue 2.
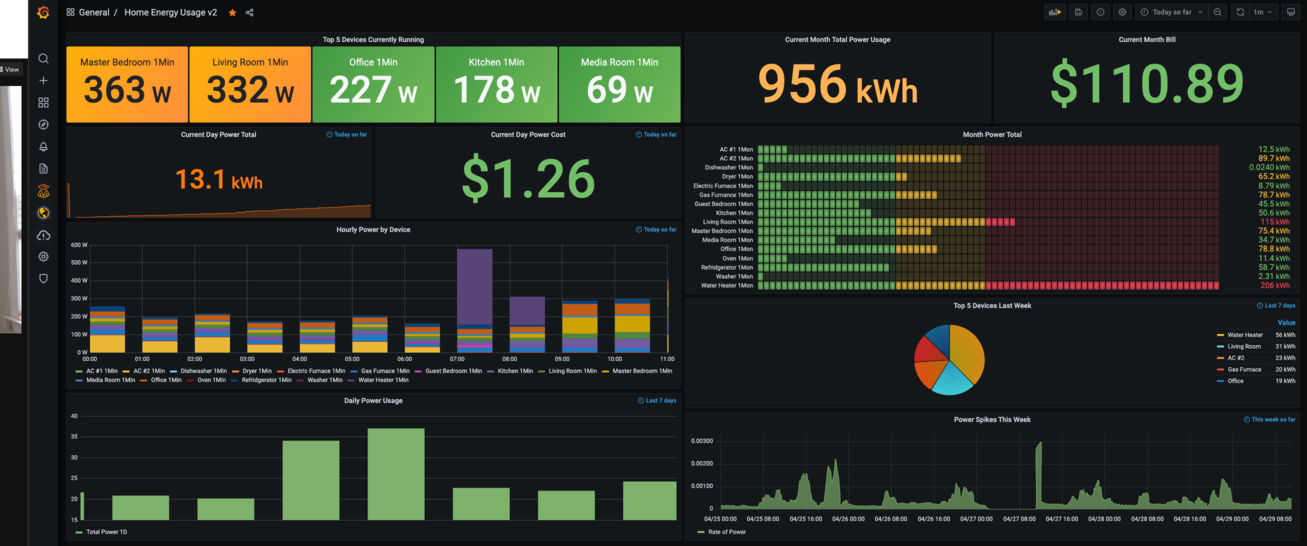
This grafana dashboard is using HomeAssistant to connect to my energy monitor ( Emporia Vue 2). We are then natively exposing metrics in prometheus format from HomeAssistant and scraping those with a Prometheus server/Grafana Agent.
Grafana Blog Post Here: https://grafana.com/blog/2021/04/15/learn-how-to-monitor-your-energy-use-at-home-with-a-raspberry-pi-grafana-and-prometheus/?src=li&mdm=social
Data source config
Collector type:
Collector plugins:
Collector config:
Revisions
Upload an updated version of an exported dashboard.json file from Grafana
| Revision | Description | Created | |
|---|---|---|---|
| Download |
Home Assistant
Easily monitor Home Assistant, an open source software platform designed for home automation, with Grafana Cloud's out-of-the-box monitoring solution.
Learn more