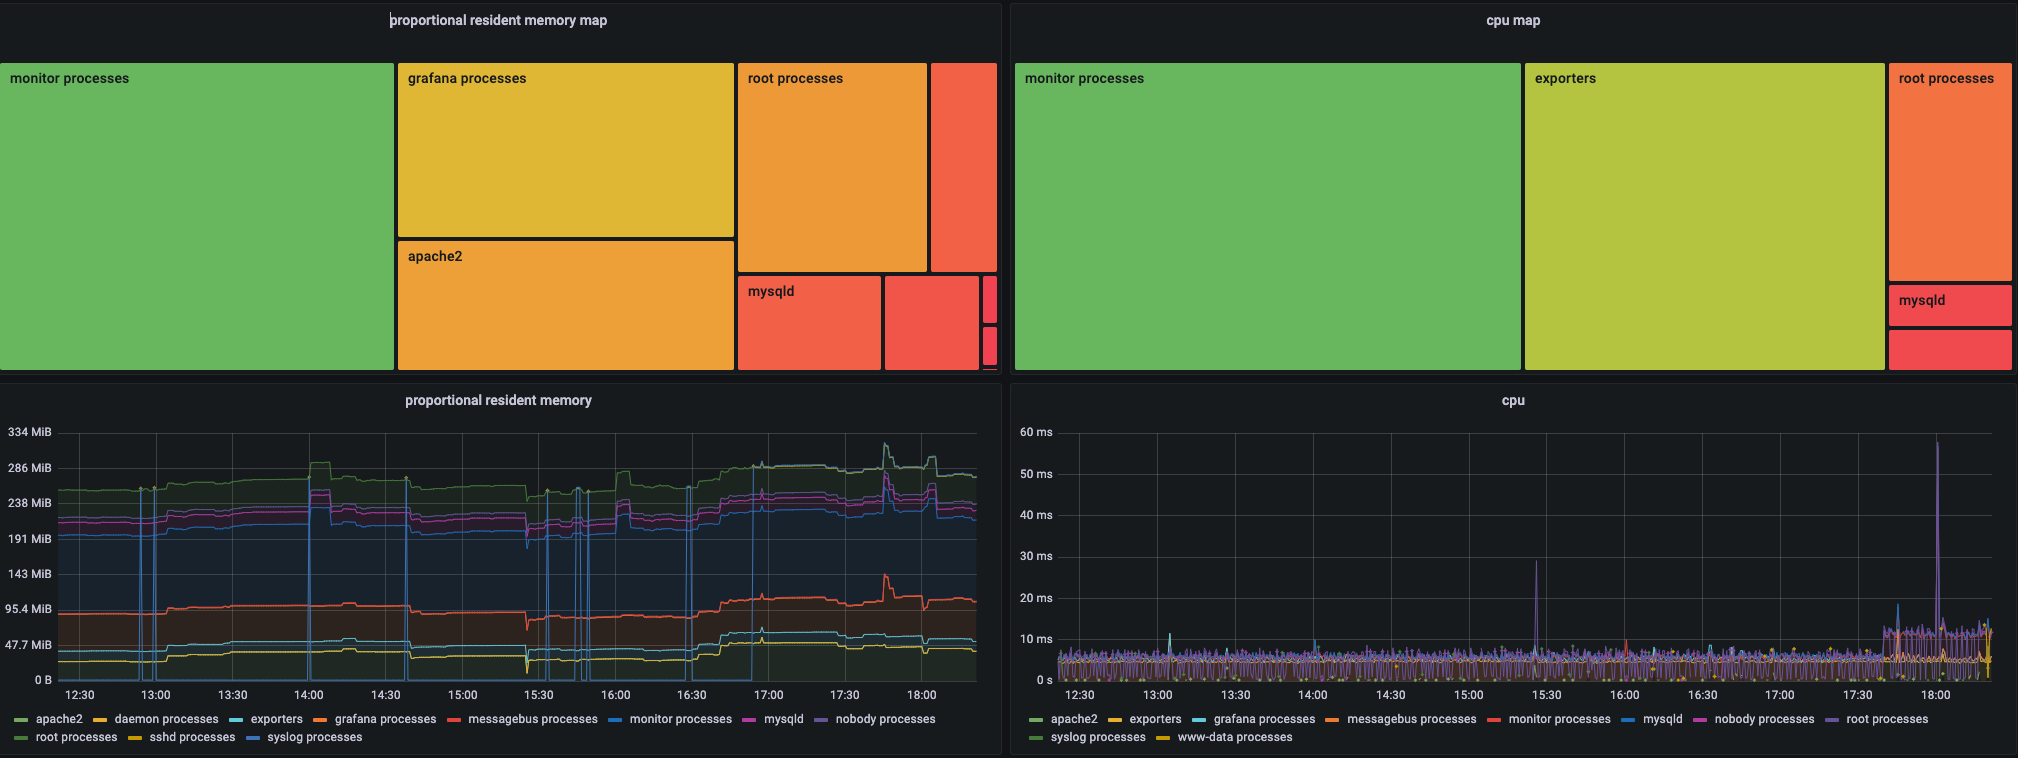
process exporter dashboard with treemap
This dashboard is another version of Named processes dashboard Expects metrics exported by https://github.com/ncabatoff/process-exporter .
This dashboard is another version of Named processes dashboard
https://grafana.com/grafana/dashboards/249
with a memory map panel which shows latest resident memory map , it's helpful to check top processes that consume a lot of memory immediately
see also: https://dasalog.hatenablog.jp/entry/2021/01/17/185152 (Japanese)
github repository: https://github.com/egmc/egmc-grafana-dashboards
2024/4/6 update(including breaking changes)
- migrate graph panels to timeseries panels
2022/2/13 update(including breaking changes)
- this dashboard expects process-exporter => v0.7.2, and run with root privilege from now on
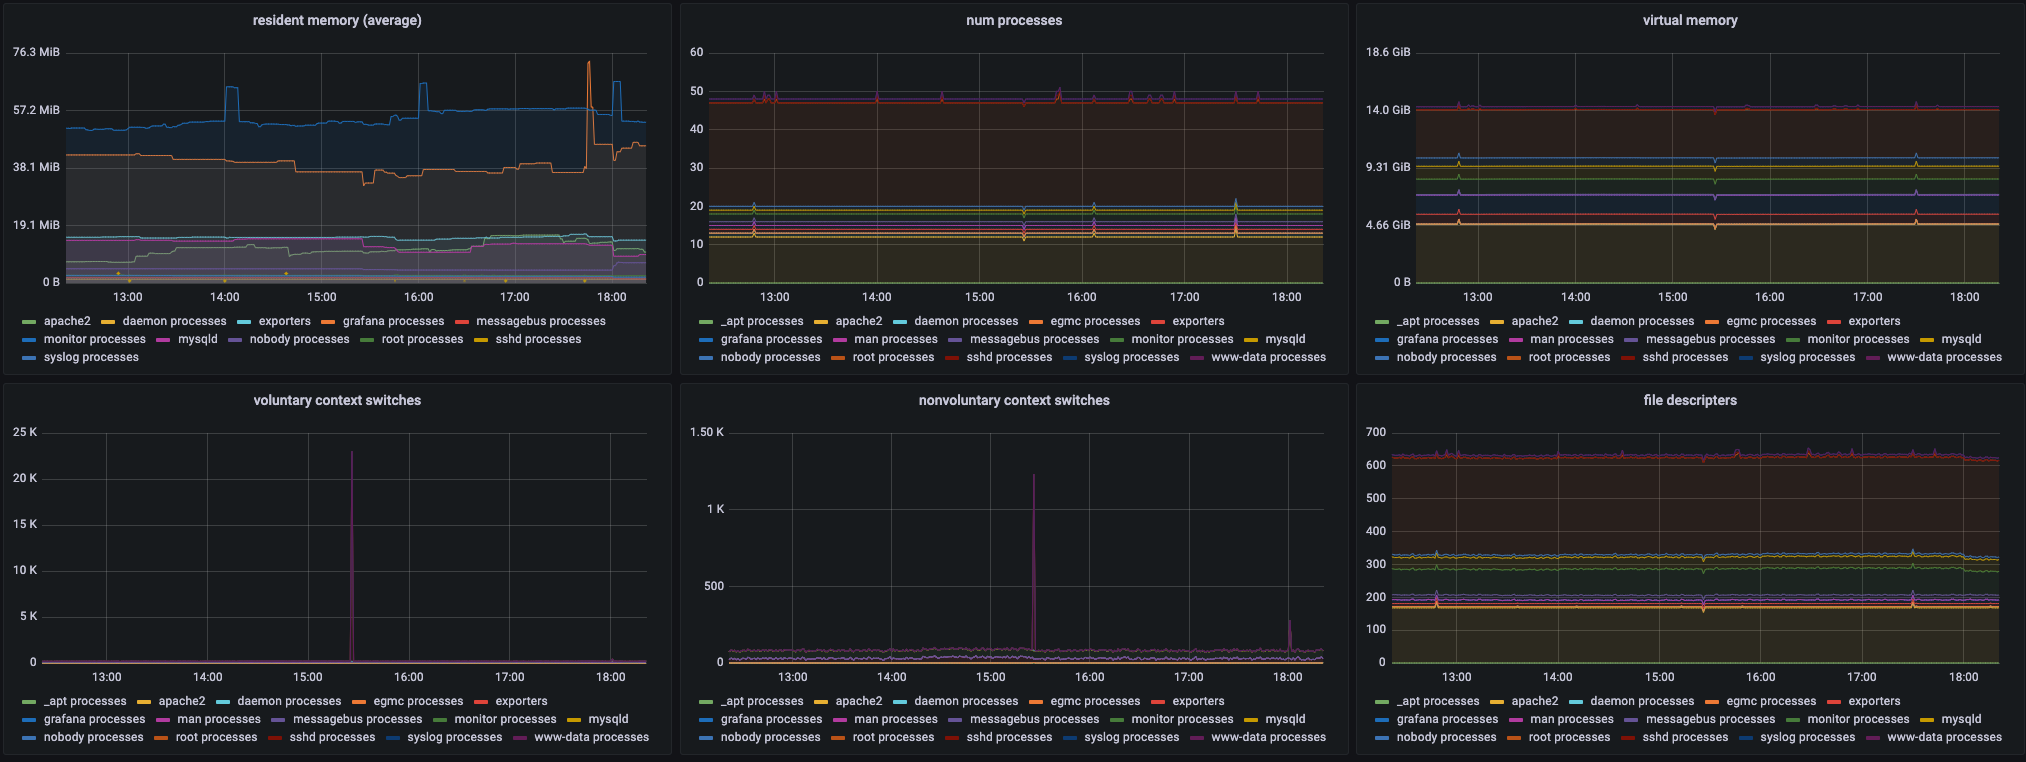
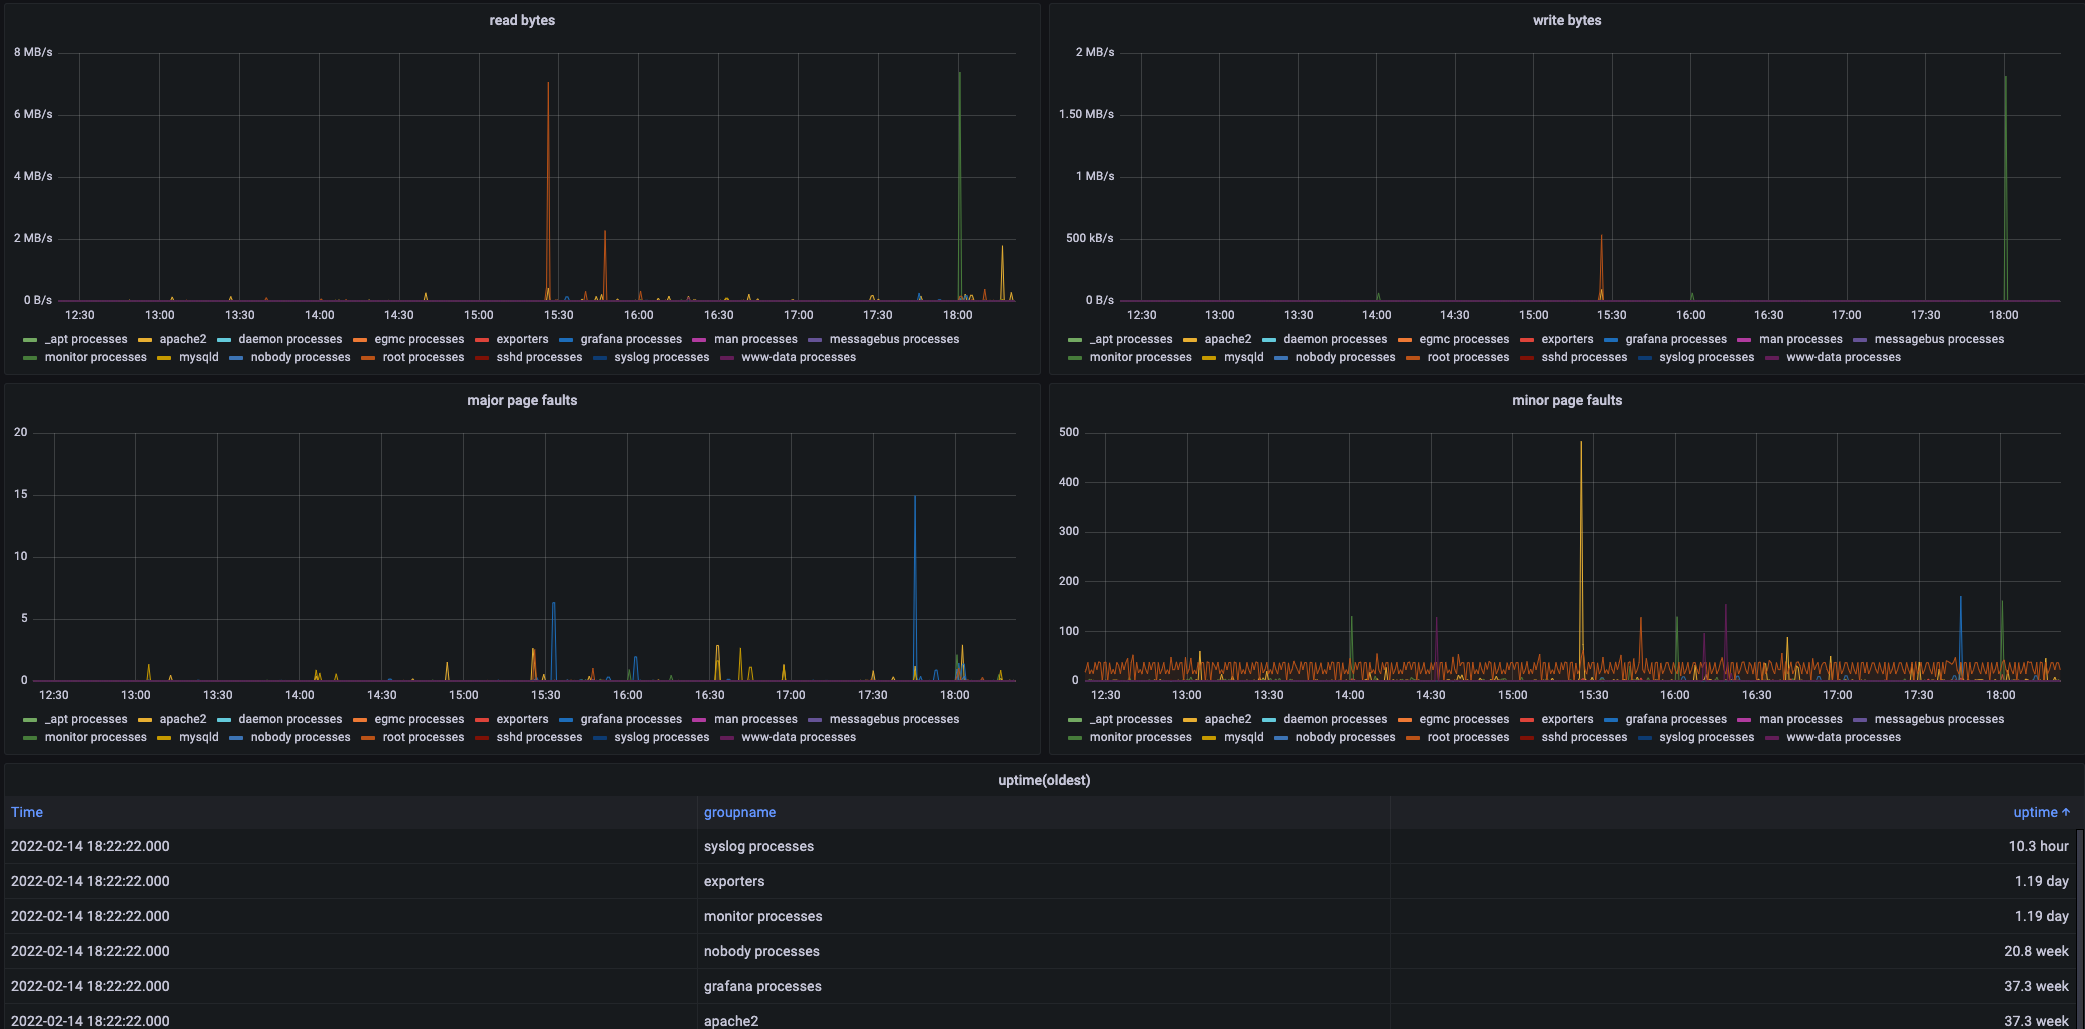
- add page faults, average resident memory, uptime graphs
- use proportional resident metrics instead of resident metrics for tree panel(https://github.com/ncabatoff/process-exporter#memory_bytes-gauge), since it shows closer value to actual memory usage ratio
2021/4/4 minor update
- sort tooltip
- add more panels: ctx switch, open fd
Data source config
Collector type:
Collector plugins:
Collector config:
Revisions
Upload an updated version of an exported dashboard.json file from Grafana
| Revision | Description | Created | |
|---|---|---|---|
| Download |