Analytics - NGINX / LOKI v2+ Data Source / Promtail v2+ Tool
Nginx access log analytics dashboard using Promtail and Loki v2+. Prometheus datasource is created from Loki service.
Revision - 21st June 2022
- Updated visitor map to support week on week comparison and top country listing
Revision - 20th February 2021
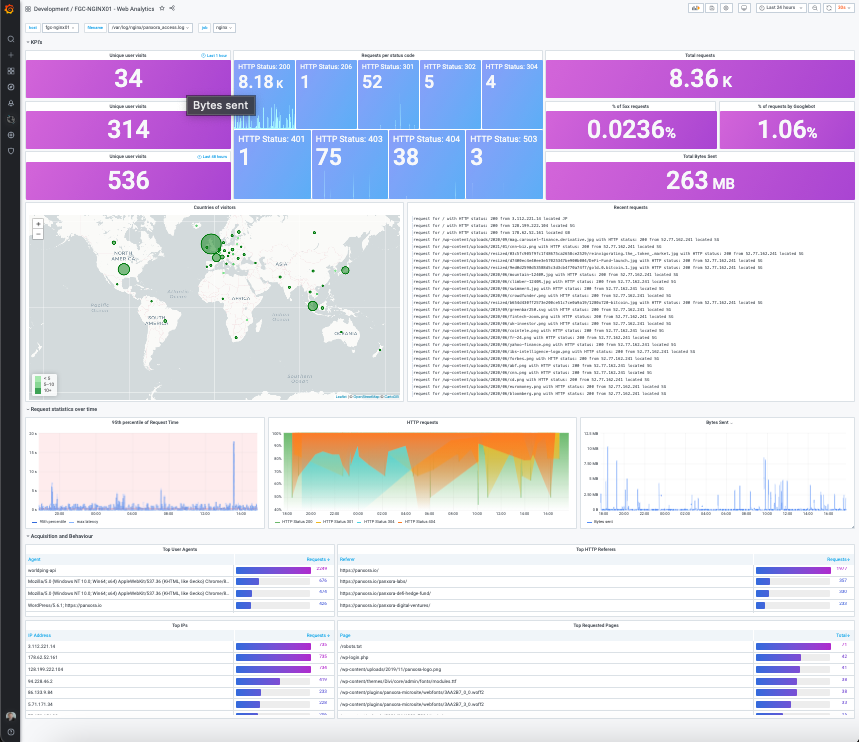
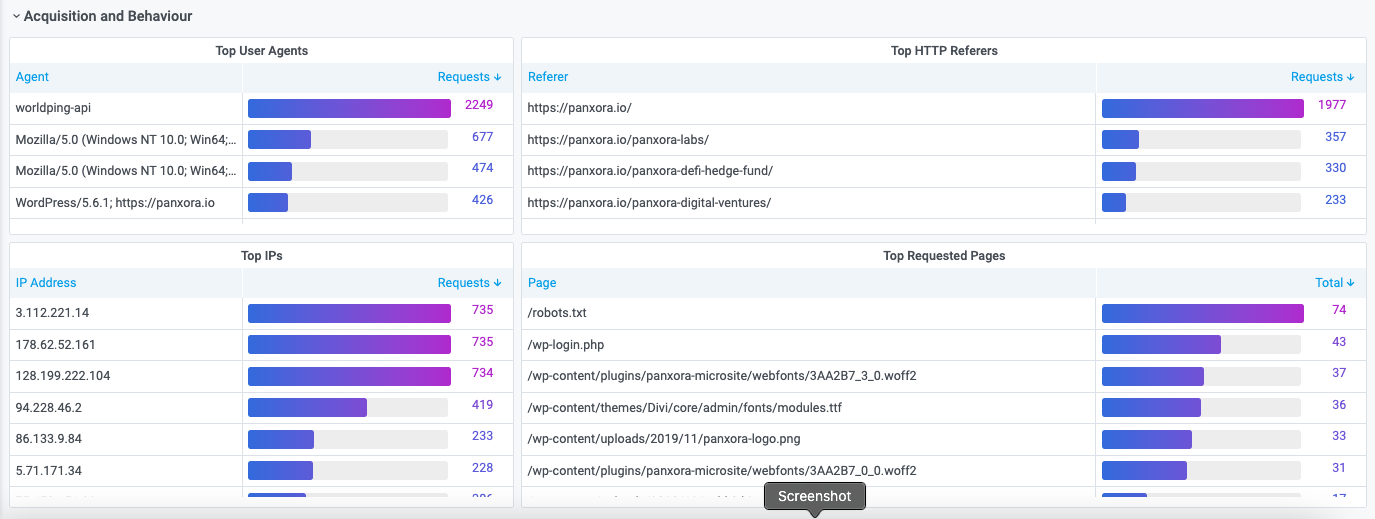
- Changed overall dashboard look and initial display of panels.
Revision - 16th February 2021
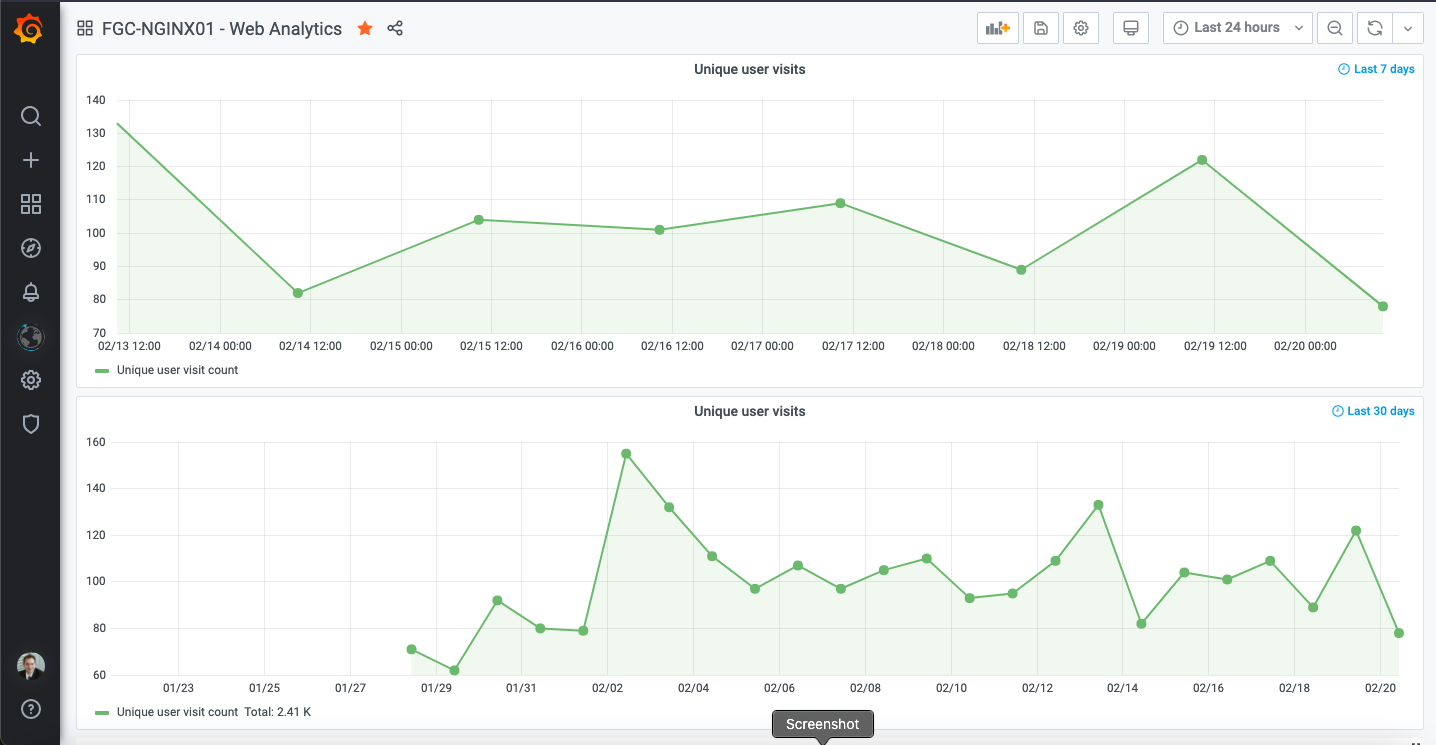
- Last 30 day graph of unique visitors to site added
- Removed more browser and crawler bot statistics from unique visitors and other relevant panels
Revision - 12th February 2021
- Changed Last 7 day graph from 'new time series beta graph' to standard graph display.
- Removed further browser and crawler bot statistics from relevant panel - to add these back in edit the panel and remove below from query on each panel.
| http_user_agent !~ ".*bot.*" | remote_addr !~ "2001:4ca0:108:42::*" | remote_addr !~ "91.134.156.*" | http_user_agent != "worldping-api" | request_uri !~ "/wp-.*" | request_uri !~ "//wp-.*" | request_uri !~ "/*.wordfence.*" | request_uri !~ "/robots.txt" | request_uri !~ "/xmlrpc.php"
Extension of original dashboard
https://grafana.com/grafana/dashboards/12559?pg=dashboards&plcmt=featured-main
Setup of nginx, promtail & loki required
https://www.youtube.com/watch?v=kR5ay4lX0OM
Required nginx json log format configuration described below
log_format json_analytics escape=json '{'
                            '"msec": "$msec", ' # request unixtime in seconds with a milliseconds resolution
                            '"connection": "$connection", ' # connection serial number
                            '"connection_requests": "$connection_requests", ' # number of requests made in connection
                    '"pid": "$pid", ' # process pid
                    '"request_id": "$request_id", ' # the unique request id
                    '"request_length": "$request_length", ' # request length (including headers and body)
                    '"remote_addr": "$remote_addr", ' # client IP
                    '"remote_user": "$remote_user", ' # client HTTP username
                    '"remote_port": "$remote_port", ' # client port
                    '"time_local": "$time_local", '
                    '"time_iso8601": "$time_iso8601", ' # local time in the ISO 8601 standard format
                    '"request": "$request", ' # full path no arguments if the request
                    '"request_uri": "$request_uri", ' # full path and arguments if the request
                    '"args": "$args", ' # args
                    '"status": "$status", ' # response status code
                    '"body_bytes_sent": "$body_bytes_sent", ' # the number of body bytes exclude headers sent to a client
                    '"bytes_sent": "$bytes_sent", ' # the number of bytes sent to a client
                    '"http_referer": "$http_referer", ' # HTTP referer
                    '"http_user_agent": "$http_user_agent", ' # user agent
                    '"http_x_forwarded_for": "$http_x_forwarded_for", ' # http_x_forwarded_for
                    '"http_host": "$http_host", ' # the request Host: header
                    '"server_name": "$server_name", ' # the name of the vhost serving the request
                    '"request_time": "$request_time", ' # request processing time in seconds with msec resolution
                    '"upstream": "$upstream_addr", ' # upstream backend server for proxied requests
                    '"upstream_connect_time": "$upstream_connect_time", ' # upstream handshake time incl. TLS
                    '"upstream_header_time": "$upstream_header_time", ' # time spent receiving upstream headers
                    '"upstream_response_time": "$upstream_response_time", ' # time spend receiving upstream body
                    '"upstream_response_length": "$upstream_response_length", ' # upstream response length
                    '"upstream_cache_status": "$upstream_cache_status", ' # cache HIT/MISS where applicable
                    '"ssl_protocol": "$ssl_protocol", ' # TLS protocol
                    '"ssl_cipher": "$ssl_cipher", ' # TLS cipher
                    '"scheme": "$scheme", ' # http or https
                    '"request_method": "$request_method", ' # request method
                    '"server_protocol": "$server_protocol", ' # request protocol, like HTTP/1.1 or HTTP/2.0
                    '"pipe": "$pipe", ' # "p" if request was pipelined, "." otherwise
                    '"gzip_ratio": "$gzip_ratio", '
                    '"http_cf_ray": "$http_cf_ray",'
                    '"geoip_country_code": "$geoip_country_code"'
                    '}';
access_log /var/log/nginx/access.log json_analytics;
Adding log_format to sites-available on Nginx :
server {
....
             access_log /var/log/nginx/website_access.log json_analytics;
For IP to country mapping, also enable the Geo_IP module:
geoip_country /etc/nginx/GeoIP.dat;
geoip_city /etc/nginx/GeoIPCity.dat;
Option if you are using Cloudflare IP Geo location you can change the log_format :
'"geoip_country_code": "$http_cf_ipcountry"'
Cloudflare IP Geo location : https://support.cloudflare.com/hc/en-us/articles/200168236-Configuring-Cloudflare-IP-Geolocation
Promtail scrapes the log files best when you mount the log volume in the docker container.
$ sudo mv promtail-config.yaml /mnt/config/
$ docker create --name promtail --restart unless-stopped -v /mnt/config:/mnt/config -v /var/log:/var/log grafana/promtail:2.1.0 -config.file=/mnt/config/promtail-config.yaml
$ docker start promtail
Promtail-config.yml file details.
server:
http_listen_port: 9080
grpc_listen_port: 0
positions:
filename: /tmp/positions.yaml
clients:
- url: http://<ip address>:3100/loki/api/v1/push
scrape_configs:
-
job_name: system
static_configs:
- targets:
- localhost
labels:
job: varlogs
host: nginx01
agent: promtail
path: /var/log/*log
-
job_name: nginx
static_configs:
- targets:
- localhost
labels:
job: nginx
host: nginx01
agent: promtail
path: /var/log/nginx/*log
Data source config
Collector config:
Upload an updated version of an exported dashboard.json file from Grafana
| Revision | Description | Created | |
|---|---|---|---|
| Download |
Adobe Analytics
With the Grafana plugin for Adobe Analytics, you can quickly visualize and query your Adobe Analytics data from within Grafana.
Learn more

