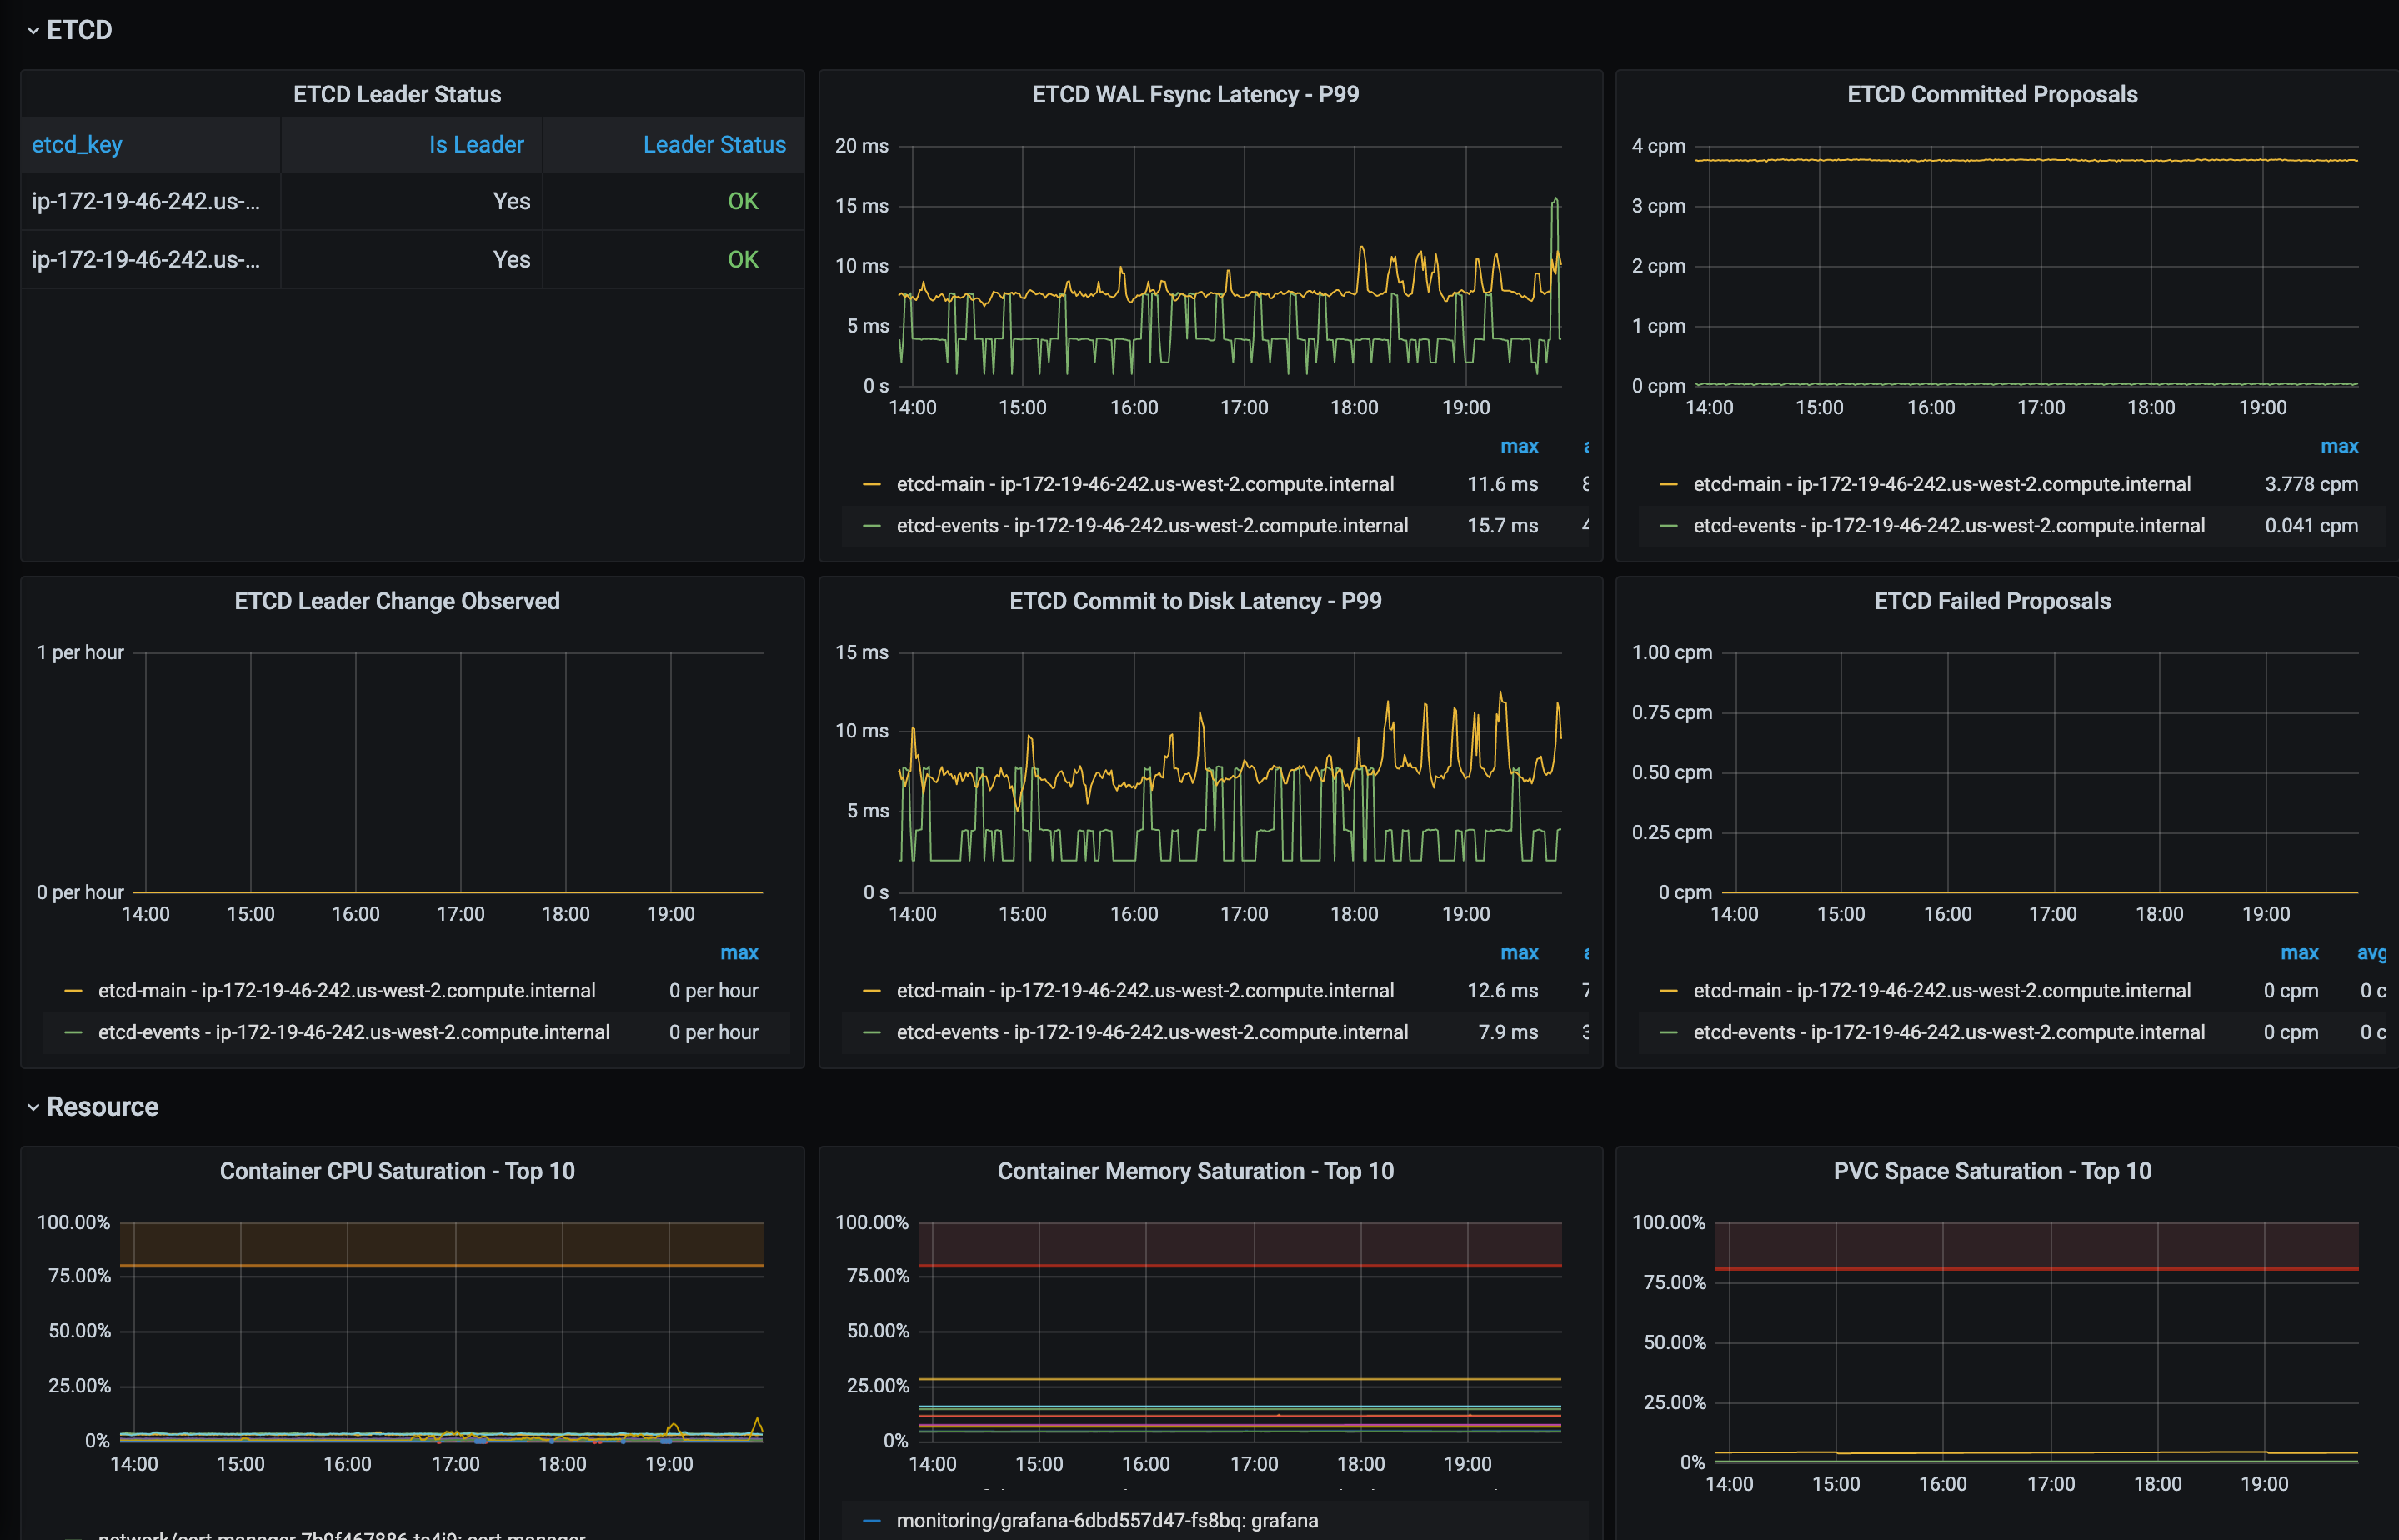
Kubernetes Overview
Assorted metrics for an overview of your cluster
A live preview is available here: https://devel.lichuan.guru/grafana/d/FlUTFUYGz/kubernetes-overview?orgId=1&refresh=30s.
Username: guest
Password: Pwd123456
Dependencies
The data used in the dashboard come from the components below, assuming no relabelling were done on them. If you don't have some of them installed, or if you have configured relabeling on them, you might have to tune the dashboard to your own need.
- kube-state-metrics
- node-exporter
- kube-apiserver
- kubelet
- kubelet/cadvisor
- ETCD
Yes, this dashboard uses quite a few data sources. But these are all common components that you should be monitoring already.
CHANGELOG
[2020-02-25] Fixed potential duplicated series errors in the container related graphs. kube-state-metrics might provide duplicated series when pod changes node.
Data source config
Collector config:
Upload an updated version of an exported dashboard.json file from Grafana
| Revision | Description | Created | |
|---|---|---|---|
| Download |
Kubernetes
Monitor your Kubernetes deployment with prebuilt visualizations that allow you to drill down from a high-level cluster overview to pod-specific details in minutes.
Learn more

