TP-Link TL-SG10x
Dashboard to view port status and pps for TPLink TL-SG10x switches (e.g. TL-SG108E) collected via Prometheus with https://github.com/mad-ady/tl-sg-prometheus-exporter
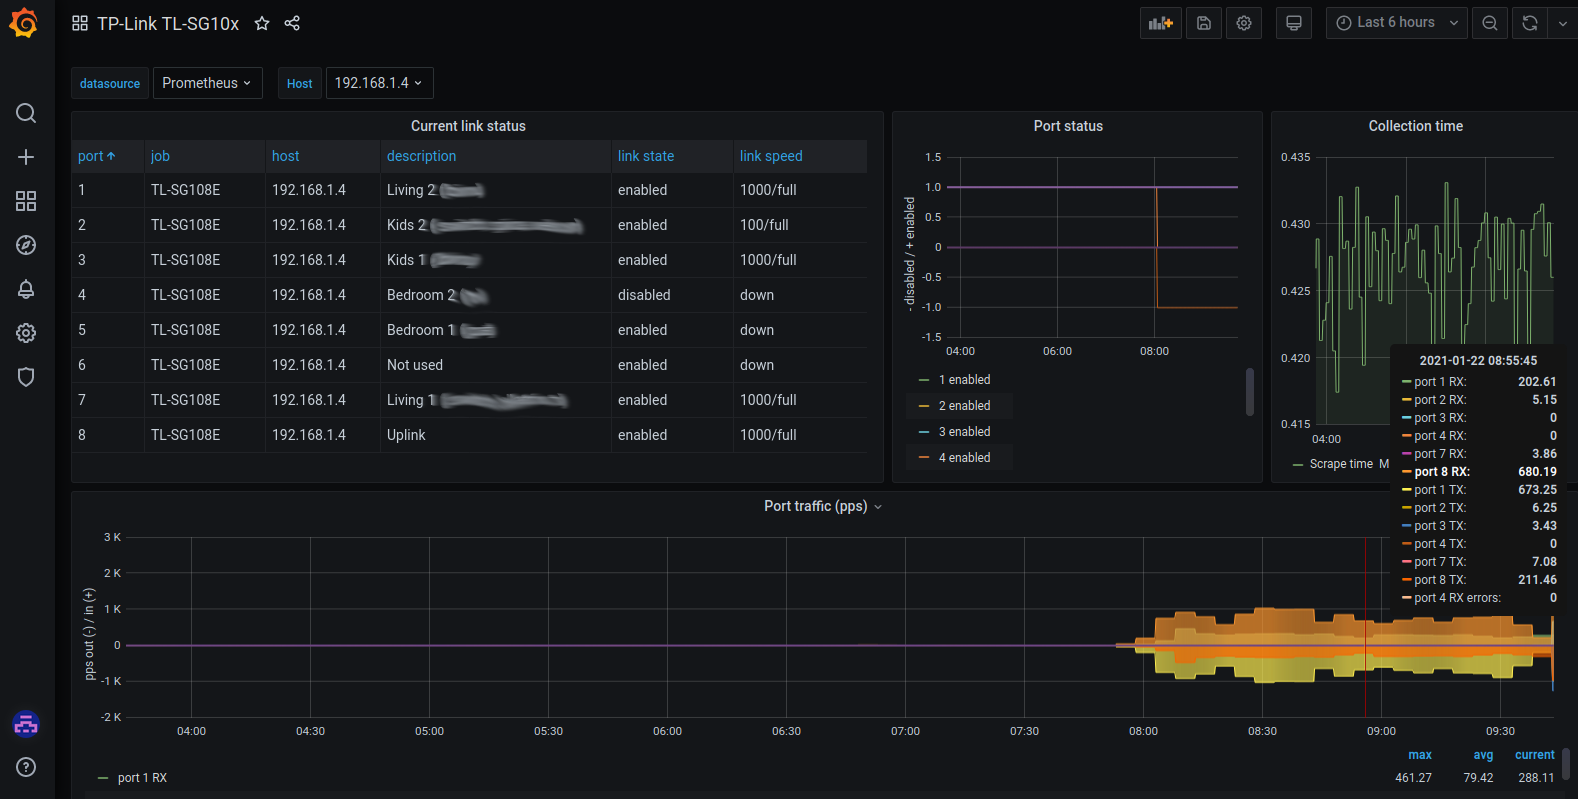
You can use this dashboard to monitor pps and link status/description for your TPLink TL-SG10x managed switches, that is collected by this prometheus custom exporter: https://github.com/mad-ady/tl-sg-prometheus-exporter
If you have ideas of improving the legend, please open an issue on Github and let me know!
Data source config
Collector type:
Collector plugins:
Collector config:
Revisions
Upload an updated version of an exported dashboard.json file from Grafana
| Revision | Description | Created | |
|---|---|---|---|
| Download |
Get this dashboard
Import the dashboard template
or
ID