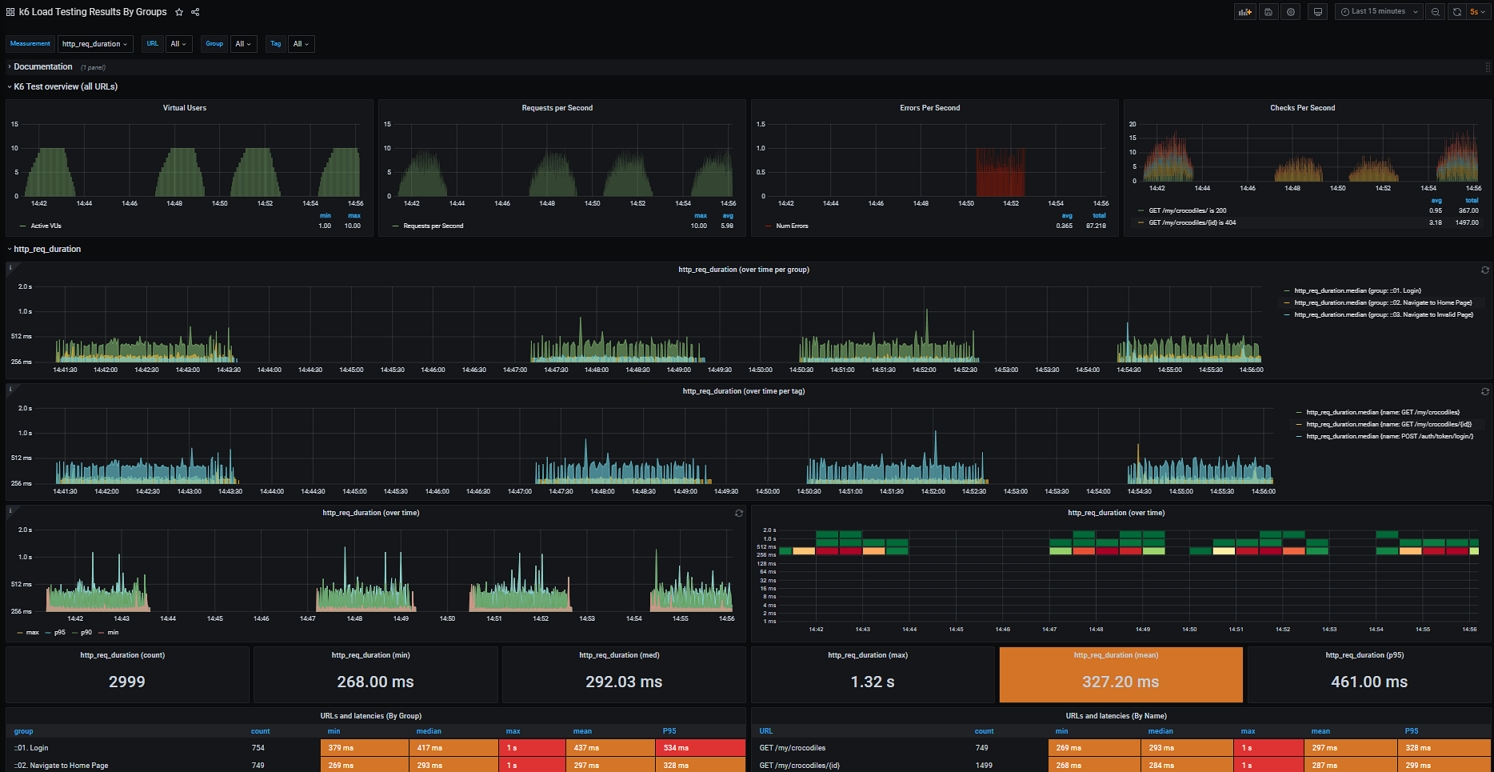
k6 Load Testing Results By Groups
A dashboard for visualizing results from the k6.io load testing tool by groups, using the InfluxDB exporter.Based on https://grafana.com/dashboards/10660
This dashboard is based on https://grafana.com/grafana/dashboards/10660 to:
group the data by groups and name tags in the load script. K6 allows you to organize load script around common logic by using Group and Tag APIs. For more info, refer to Tags and Groups.
This would allow you to monitor the http request duration over time by groups and name tags.
display the errors per second based on the value added to the rate metric. For more info, refer to Rate.
This would allow you to monitor the possible error rate in real-time during the test run.
duplicated two URLs and Latencies panels to display requests by groups and name tags.
By default, k6 differentiates every unique endpoint name when tagging the metrics it records. Recommend to override the name tag for given requests based on preferable naming. For more info, refer to Tags
Data source config
Collector config:
Upload an updated version of an exported dashboard.json file from Grafana
| Revision | Description | Created | |
|---|---|---|---|
| Download |

