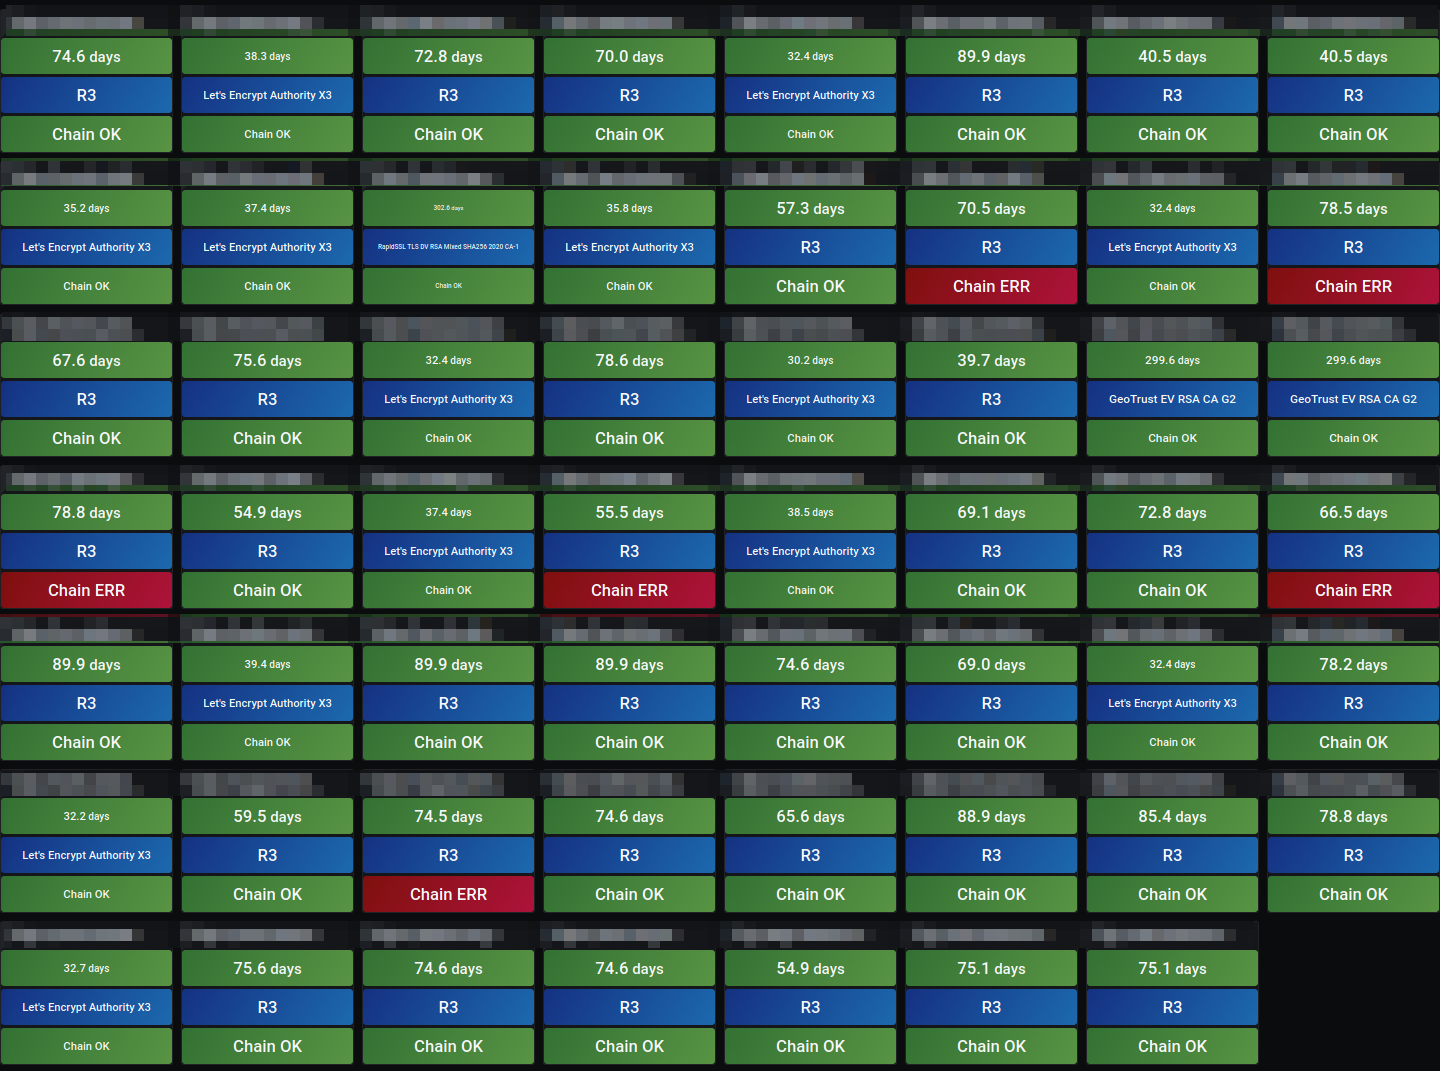
Better SSL Monitoring (x509_cert)
A very simple and visual Dashboard to monitor SSL Certificates (x.509) using the native inputs.x509_cert from Telegraf. It just works automatically once the sources are added to telegraf.
Just place the configuration to your telegraf instance and import the Dashboard template.
To just have a Box with the next due certificate on your main Situation Room Dashboard you can use the following query:
SELECT (bottom(expiry,common_name,1)/60/60/24) as exp,common_name FROM "x509_cert" WHERE time >= now() - 1h
It's easy to maintain the Config in a Git repo and pull it ever few hours to your Telegraf Server. Such a Cron could look like:
0 0,3,6,9,12,15,18,21 * * * /usr/bin/git archive --remote=ssh://git@your.gitrepo:7999/sslchec/domains.git HEAD certs.conf|tar -xO > /etc/telegraf/telegraf.d/certs.conf && killall -1 telegraf
Data source config
Collector config:
Upload an updated version of an exported dashboard.json file from Grafana
| Revision | Description | Created | |
|---|---|---|---|
| Download |

