JMeter Load Test (org.md.jmeter.influxdb2.visualizer) - influxdb v2.0 (Flux)
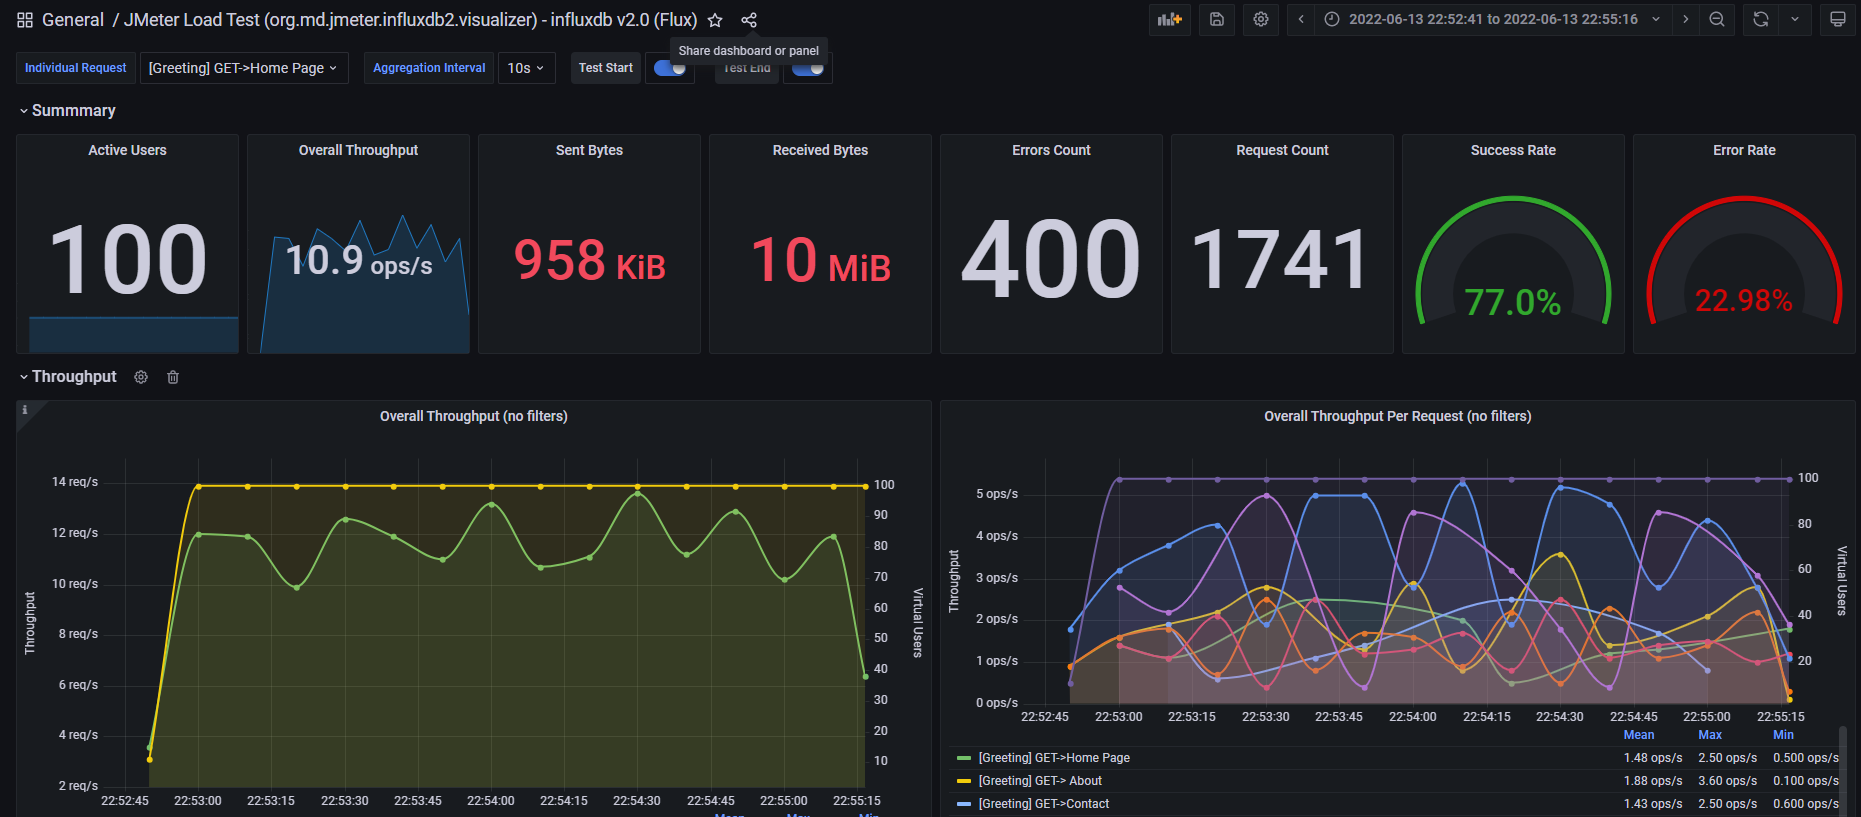
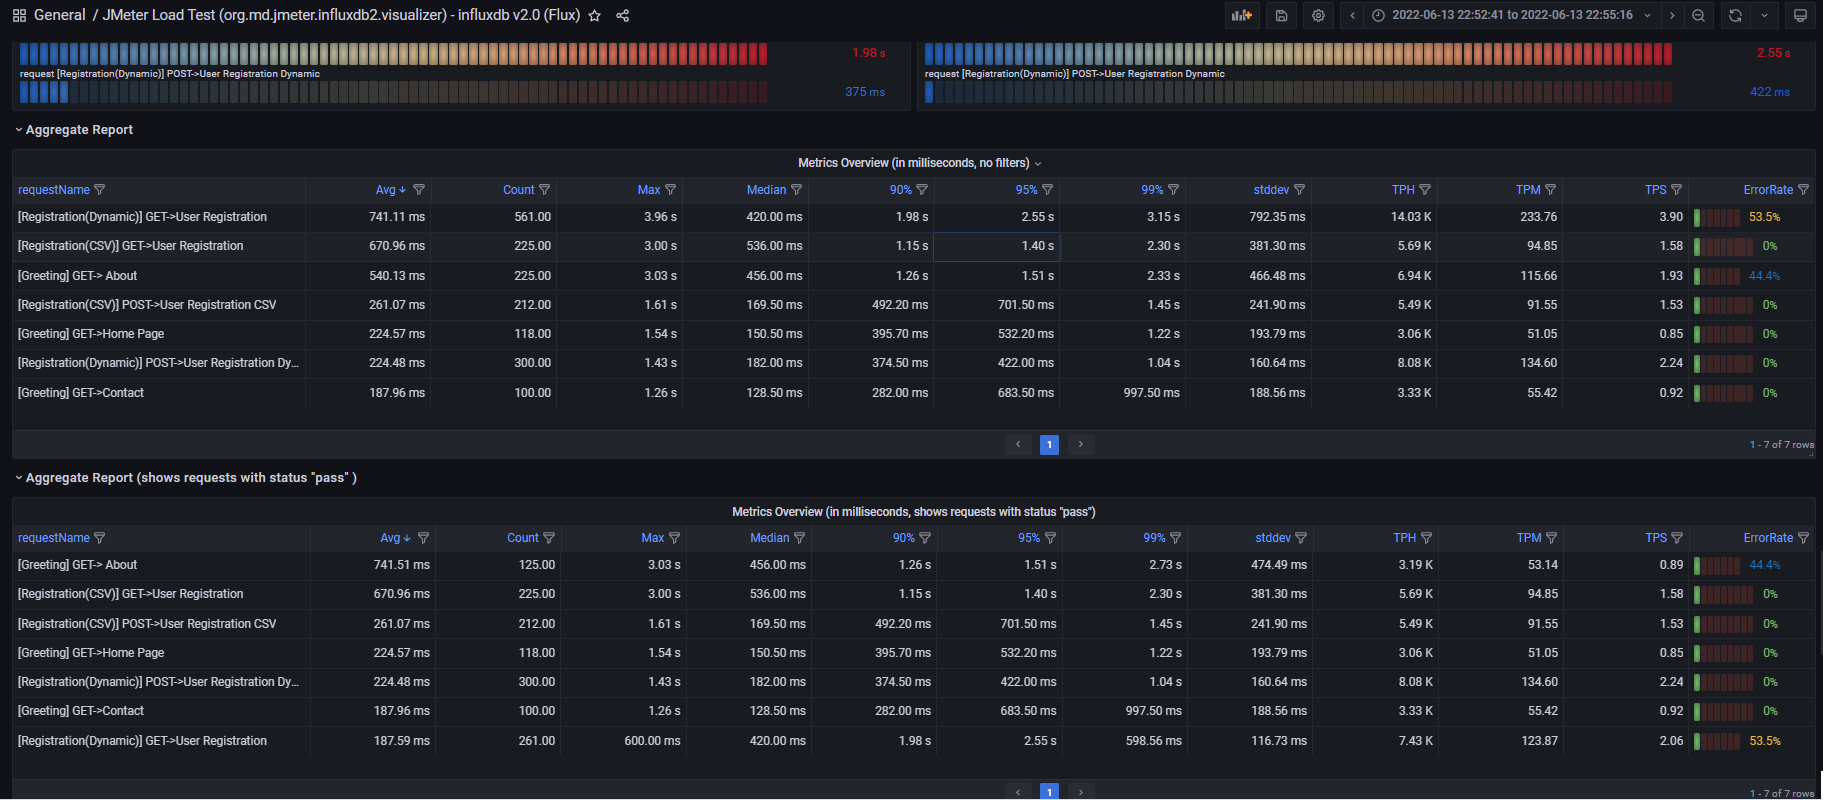
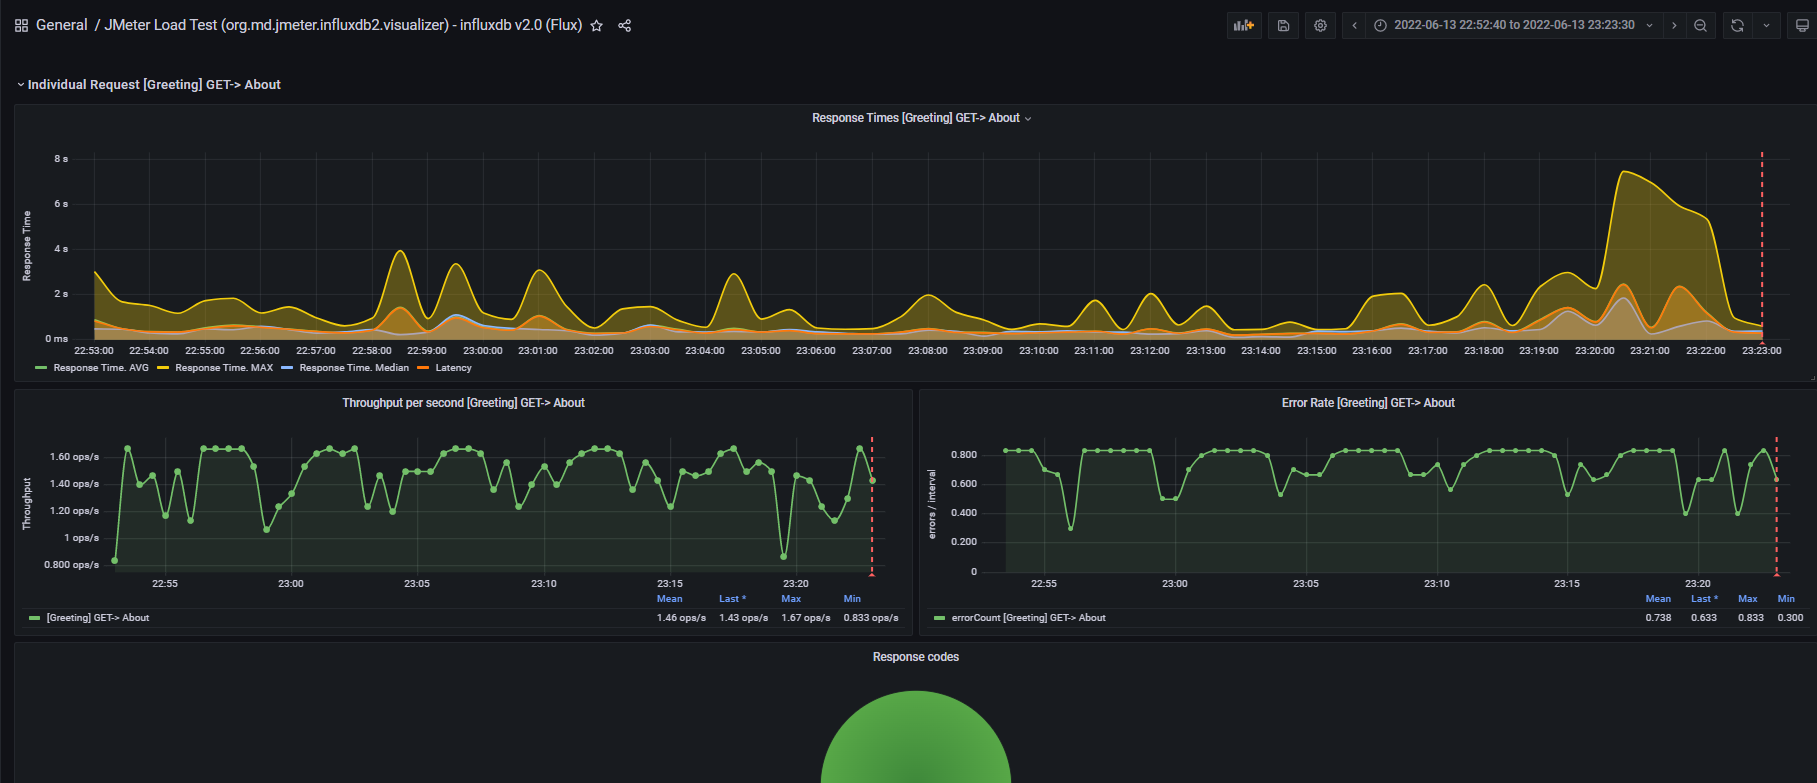
This dashboard shows live load test metrics provided by JMeter, updated bars charts.
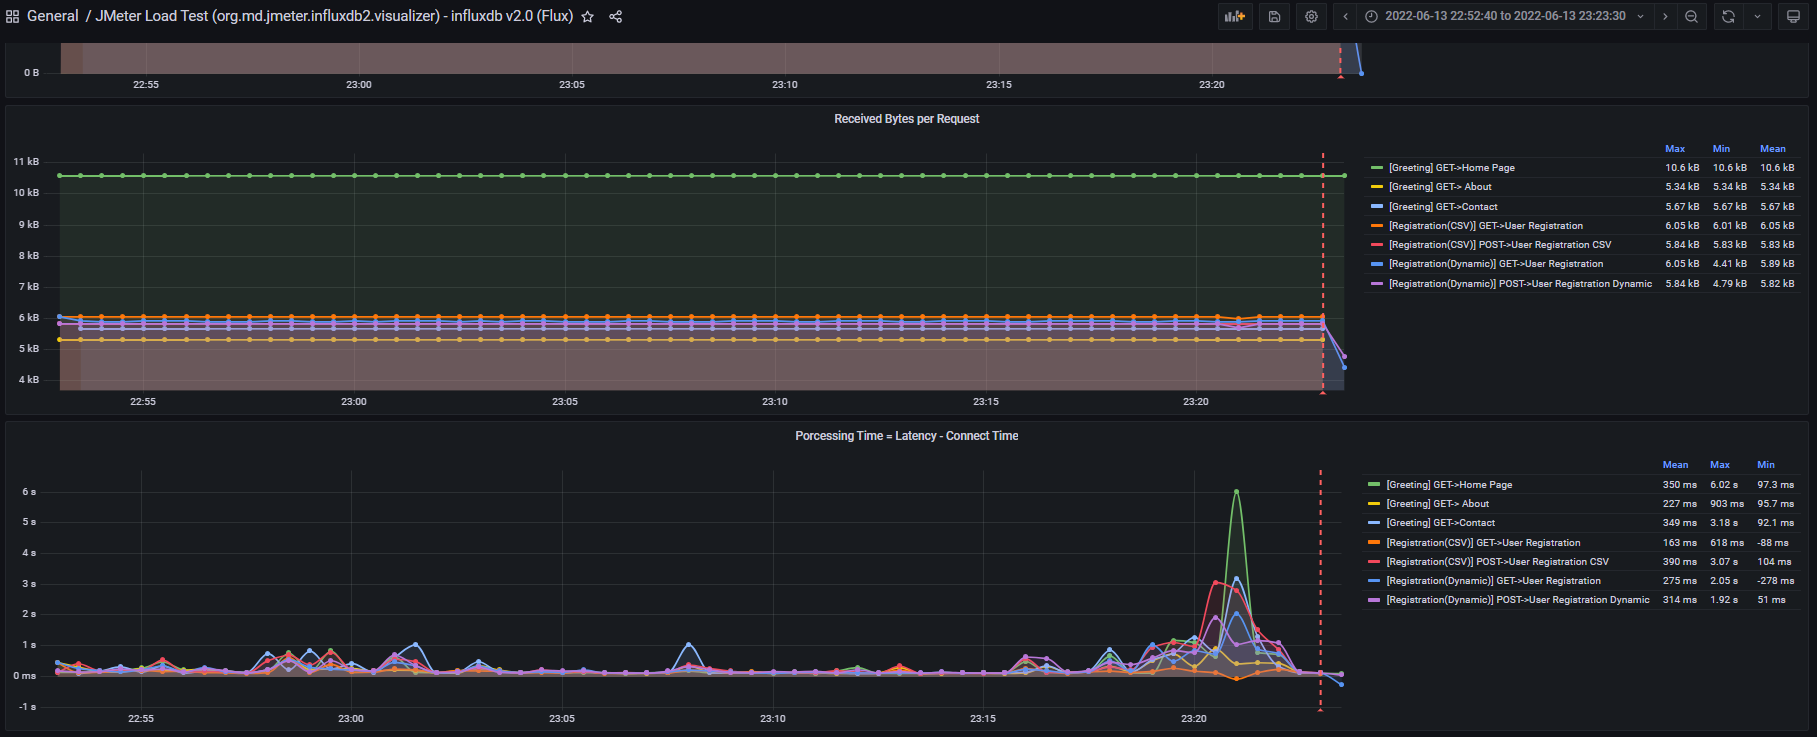
Overview:
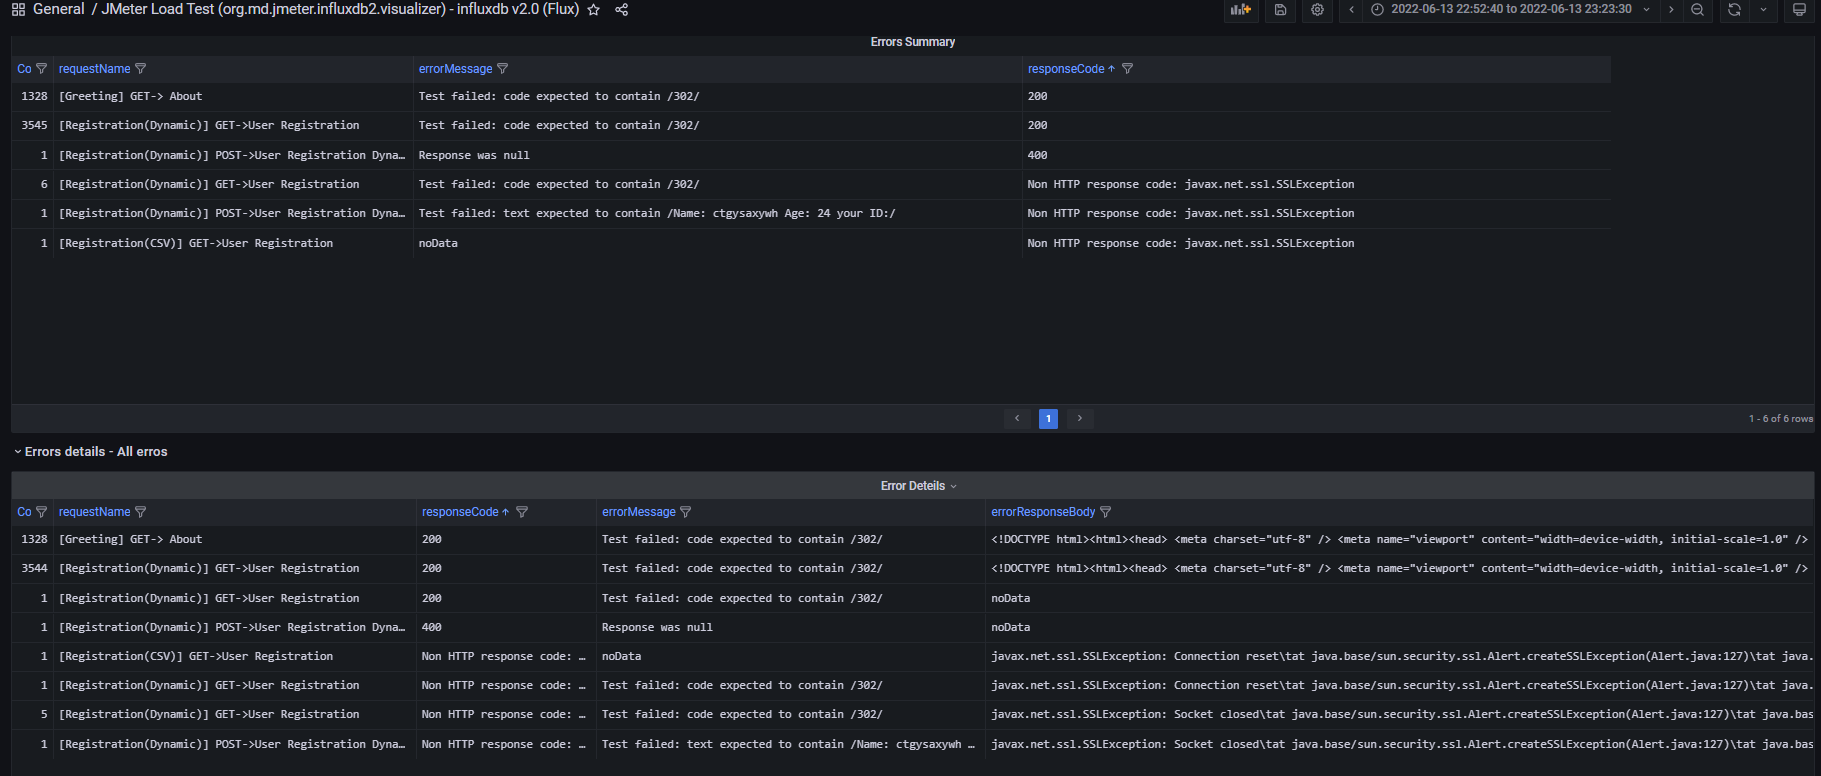
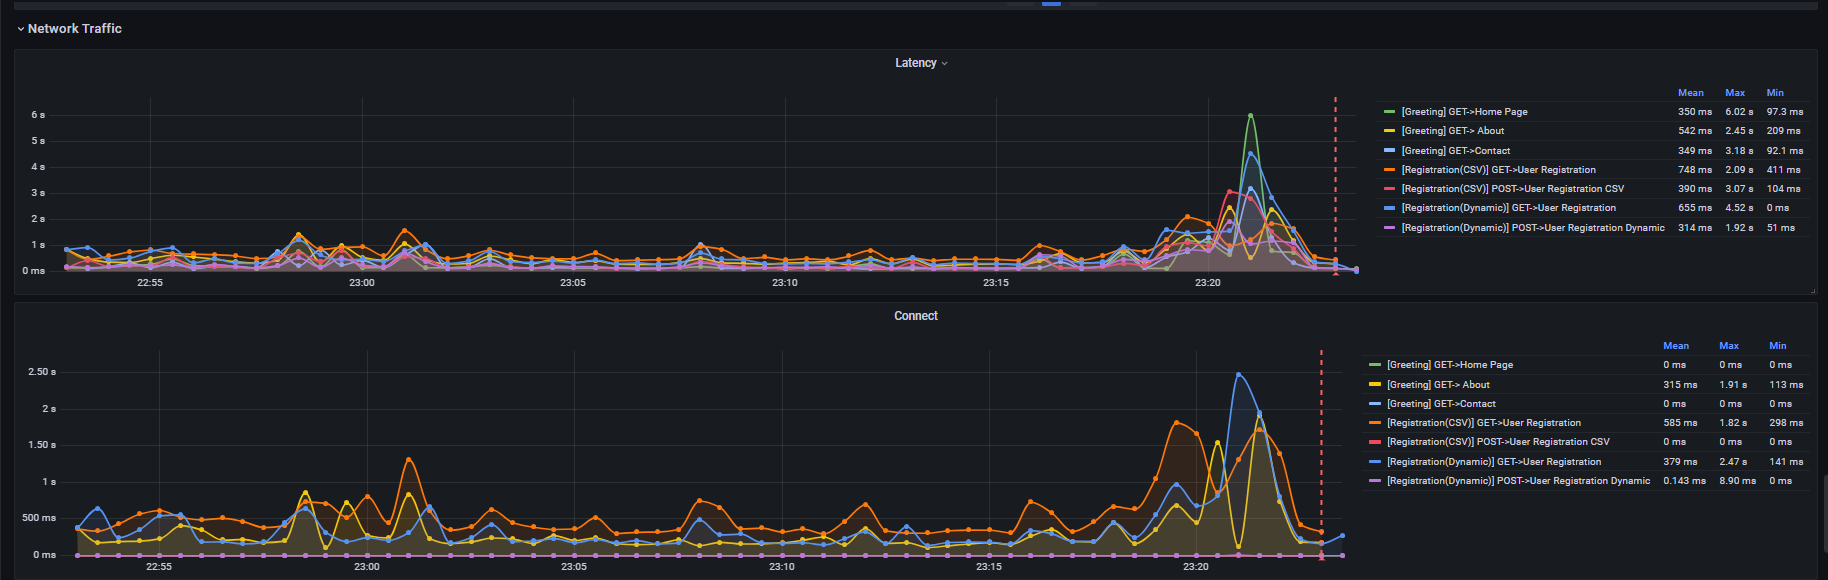
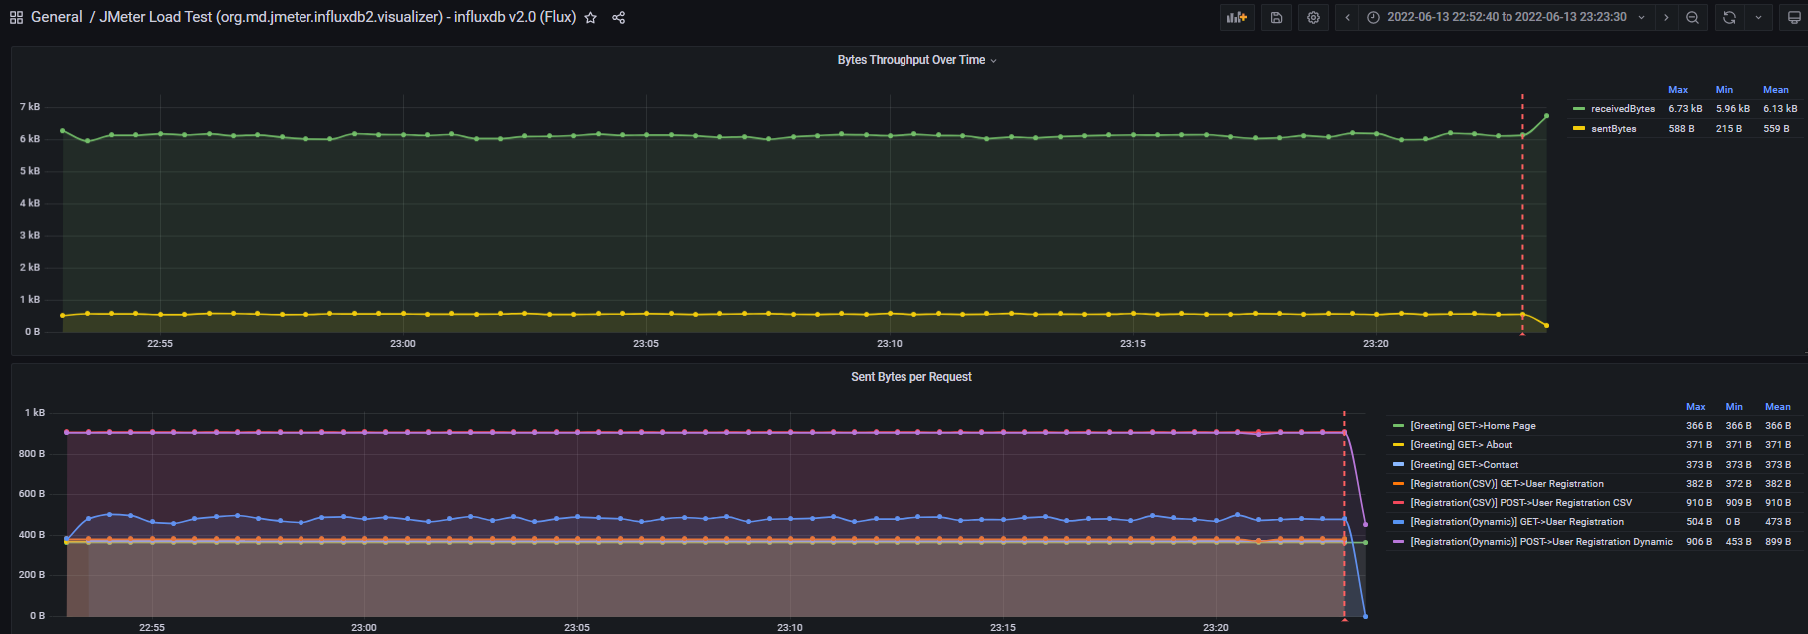
This dashboard requires Apache JMeter 5.5 and InfluxDB v2.0, (the latest was supported and tested on Grafana 9.1.6). It shows overall statistics, generates the transactions charts, aggregate report, latency, and errors overview. Note: the dashboard and solution will not work for InfluxDB v1.8. You can significantly improve your performance testing process (works for JMeter clustered solution as well)!.
New features:
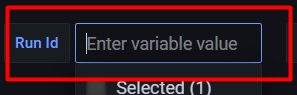
- Added the filter by "run id"
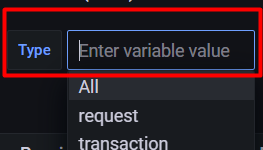
- Added the possibility to see "requests" only or "transactions".
Setup:
See full instructions on jmeter-influxdb2-listener-plugin .
- Download the plugin the latest release or depends on JMeter version. The plugin "
jmeter-plugins-influxdb2-listener-<>.jar" should be located here "~\apache-jmeter-5.x\lib\ext". - Make sure that you have Java 11 or higher version - otherwise the plugin will be not displayed on UI.
- Add Backend Listener to your test plan (Add -> Listener -> Backend Listener) and select "
io.github.mderevyankoaqa.influxdb2.visualizer.JMeterInfluxDBBackendListenerClient." - Provide in the Parameters table the InfluxDB settings, provide a name for the test, and specify which samplers to record.
- Configure the dashboard in Grafana, execute tests, and see test results.
PS.
Please feel free to reach out to me in case of any questions m.v.derevyanko@gmail.com or linkedin.
All found issue please report here
Best Regards, Michael Derevyanko
Data source config
Collector config:
Upload an updated version of an exported dashboard.json file from Grafana
| Revision | Description | Created | |
|---|---|---|---|
| Download |
InfluxDB
Easily monitor InfluxDB, an open source time series database, with Grafana Cloud's out-of-the-box monitoring solution.
Learn more