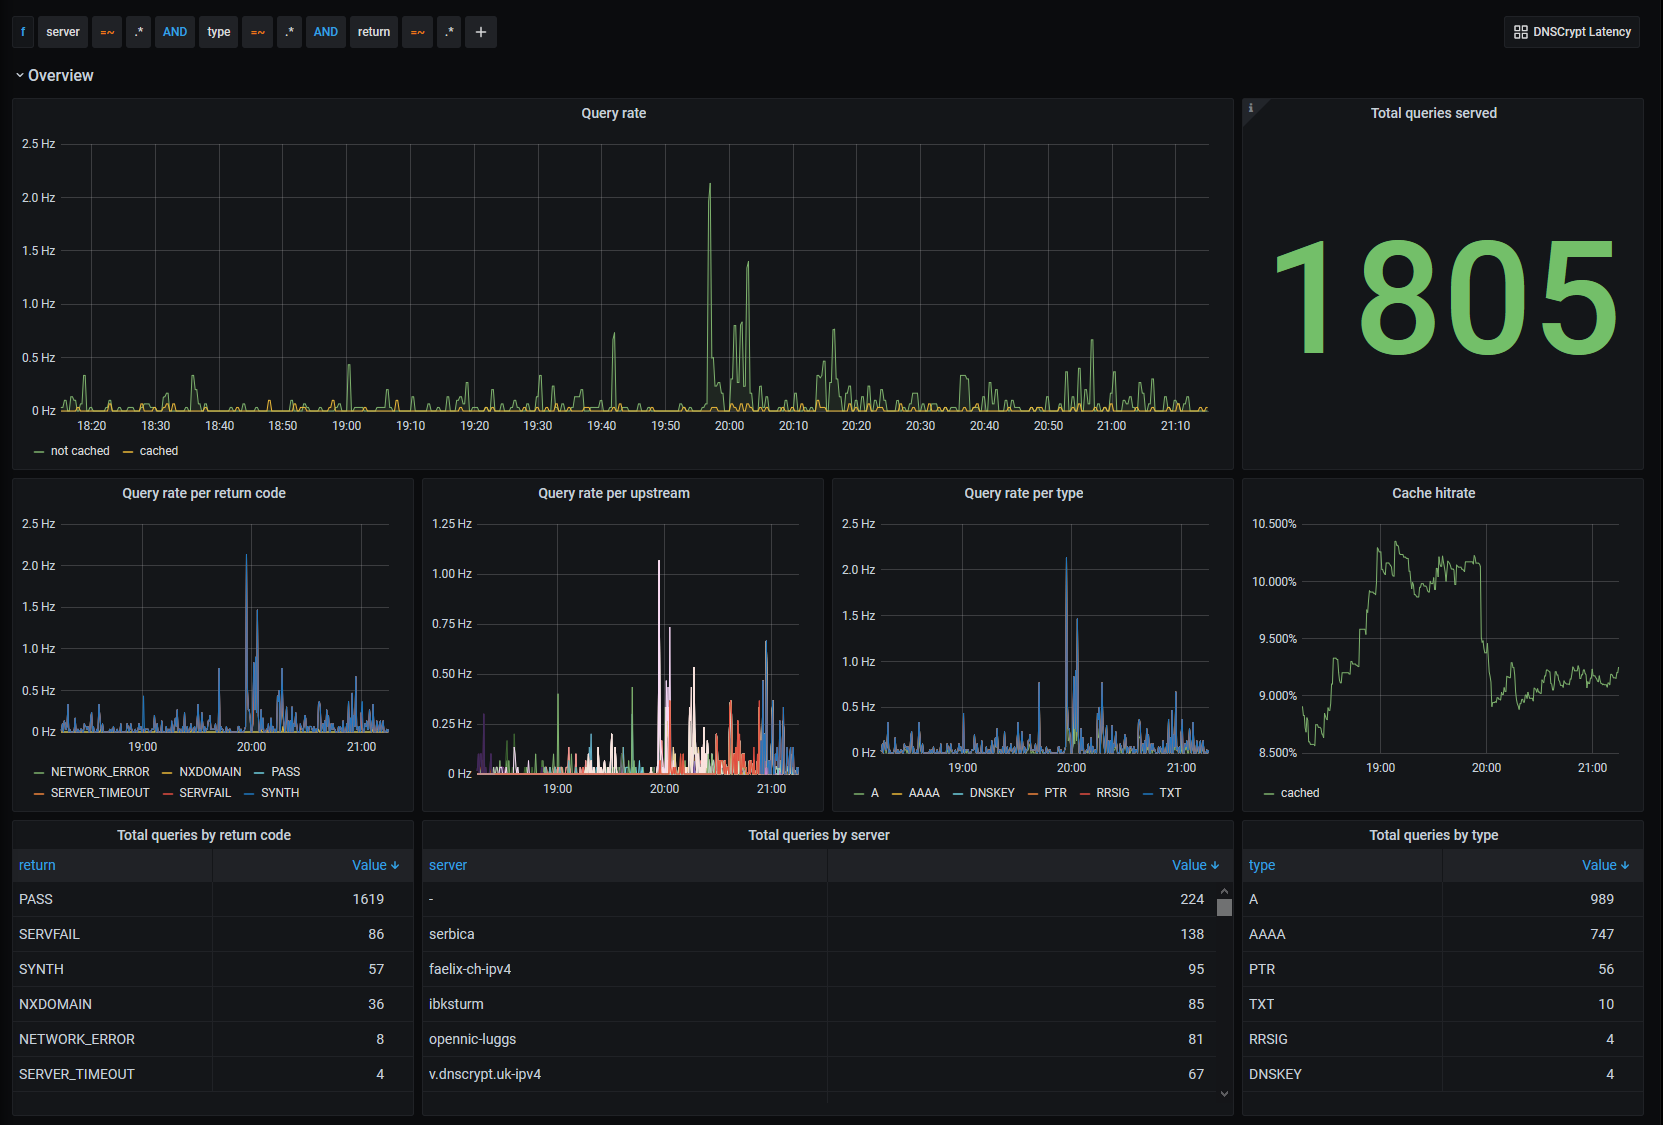
DNSCrypt overview
Shows dnscrypt-proxy's query_log in a nice graphical way by parsing its content with mtail.
How to use
- Download and install mtail
- Configure DNSCrypt-proxy daemon running to generate the
query_loginltsvformat - Save the content of the following mtail "program" to a text file
# mail "program" for DNSCrypt's query log (in ltsv format)
#
# Sample line:
#  time:1608044190 host:127.0.0.1  message:www.ripe.net    type:A  return:PASS                                                                       cached:0        duration:1      server:faelix-ch-ipv4
counter queries_total
counter queries by host, type, return, cached, server
Binning should be adapted to the latency (in ms) you have with your DNSCrypt s                                                                  ervers
histogram queries_duration_ms buckets 1, 2, 4, 8, 16, 32, 64, 128, 256 by return                                                                  , server, type
/^/ +
/time:[0-9]+\s+/ +
/host:(?P<host>\S+)\s+/ +
/message:(?P<message>\S+)\s+/ +
/type:(?P<type>\S+)\s+/ +
/return:(?P<return>\S+)\s+/ +
/cached:(?P<cached>[0-1])\s+/ +
/duration:(?P<duration>[0-9]+)\s+/ +
/server:(?P<server>\S+)/ +
/$/ {
queries_total++
queries[$host][$type][$return][$cached][$server]++
Only consider non-cached results for histograms
$cached == 0 {
queries_duration_ms[$return][$server][$type] = $duration
}
}
- Start
mtaileither via your preferred mean (See https://github.com/google/mtail/blob/master/docs/Deploying.md) - Point your prometheus installation to the
mtailendpoint - Import this dashboard in your grafana instance
Data source config
Collector config:
Upload an updated version of an exported dashboard.json file from Grafana
| Revision | Description | Created | |
|---|---|---|---|
| Download |

