Pi-hole - RESTful API
Grafana Dashboard that consumes Pi-hole API without auth. All simple, leveraging the input.http from telegraf.
Just use telegraf and the input.http with the next details, of course point to your pi-hole:
[[inputs.http]]
#PiHole URL for data in JSON format
urls = ["http://192.168.1.3/admin/api.php"]
method = "GET"
#Overwrite measurement name from default http to pihole_stats
name_override = "pihole_stats"
#Exclude host items from tags
tagexclude = ["host"]
#Data from HTTP in JSON format
data_format = "json"
#JSON values to set as string fields
json_string_fields = ["url", "status"]
insecure_skip_verify = true
Restar telegraf, and that's it.
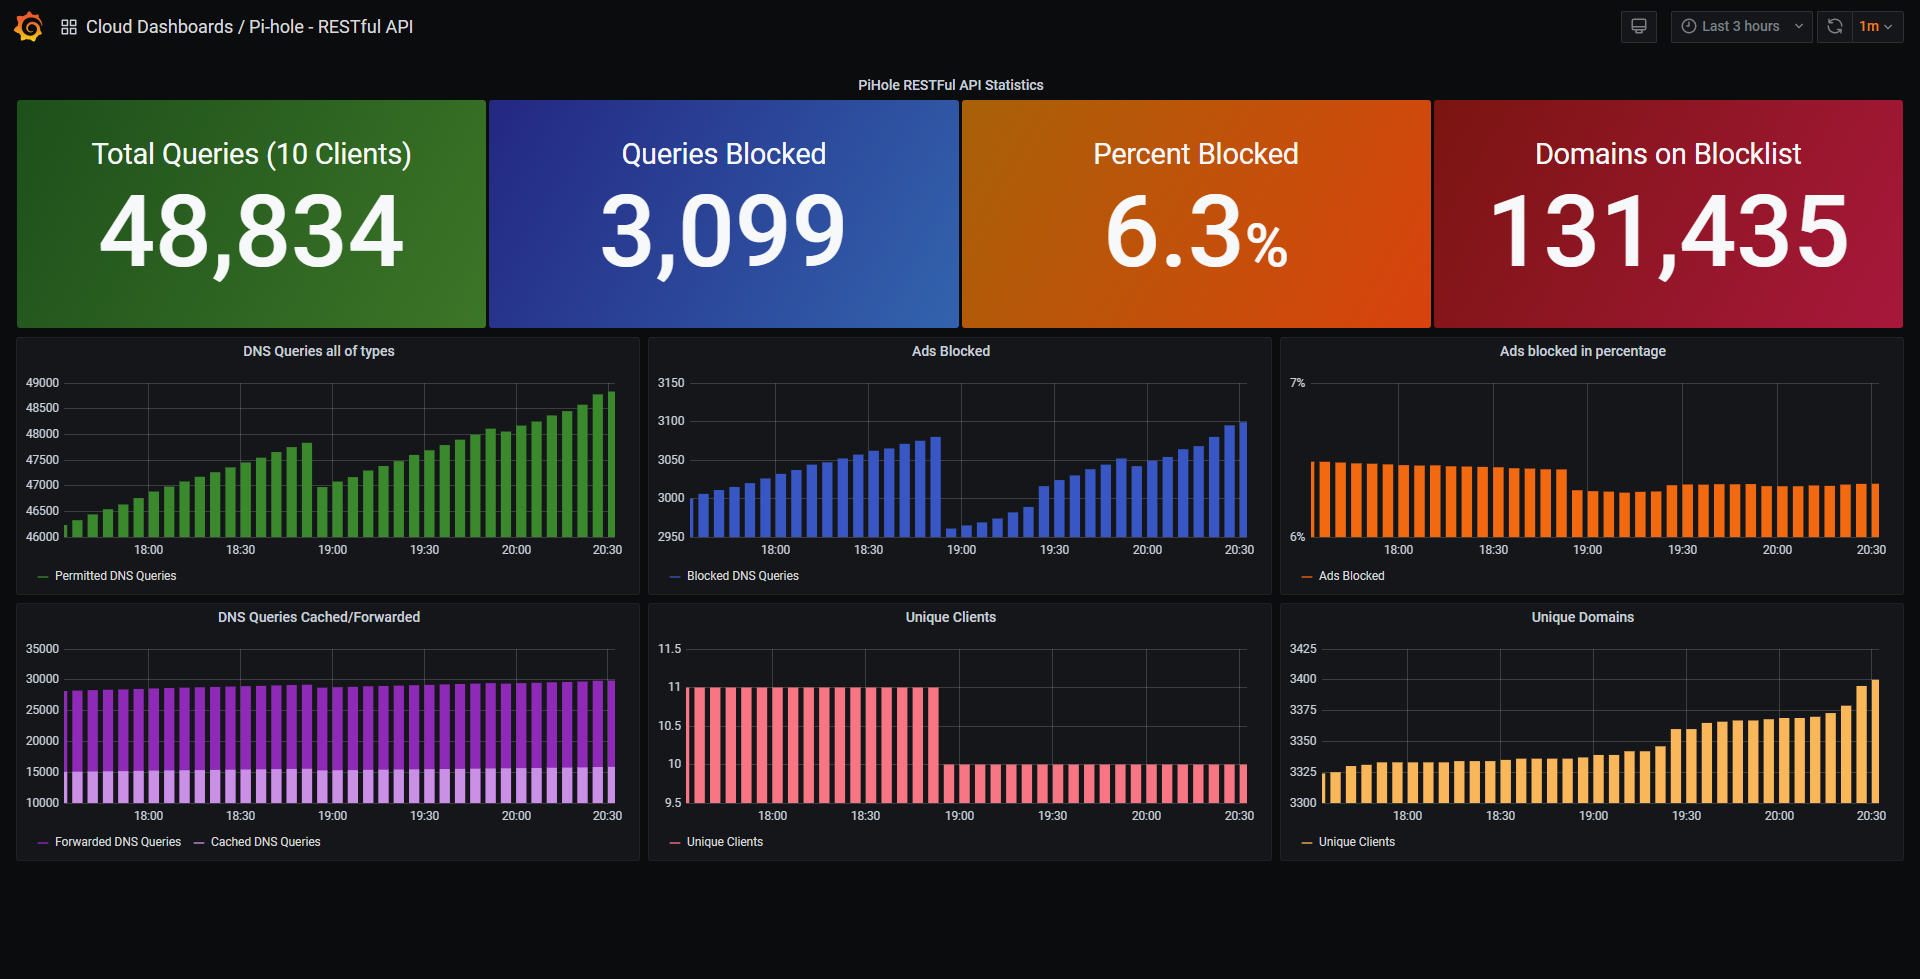
Then download or import this Dashboard to your Grafana, and you should see something similar to the next:

Hope you like it!
Data source config
Collector config:
Upload an updated version of an exported dashboard.json file from Grafana
| Revision | Description | Created | |
|---|---|---|---|
| Download |
Raspberry Pi
Easily monitor Raspberry Pi, the small, single-board computers, with Grafana Cloud's out-of-the-box monitoring solution.
Learn more
