OracleDB Monitoring - performance and table space stats
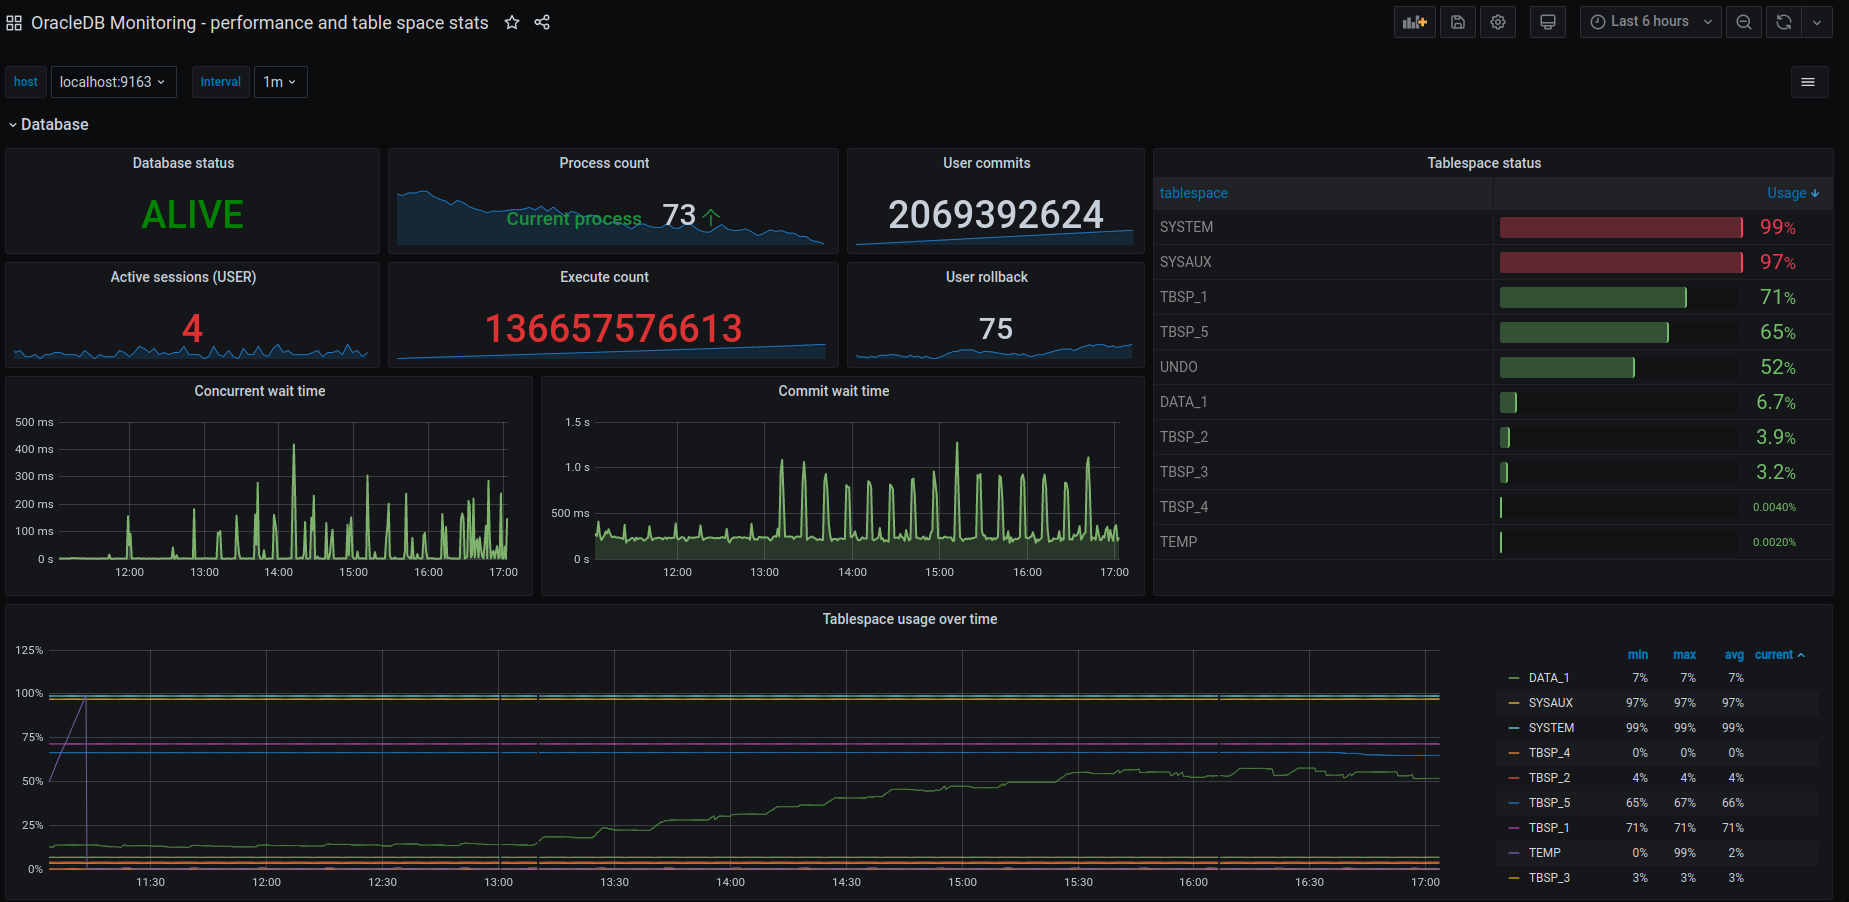
Use oracledb exporter for oracle database monitoring. Compared with other dashboards, tablespace monitoring is added, which can be expanded to set tablespace alarms
OracleDB Monitoring - performance and table space stats
Use oracledb-exporter to monitor oracle database. Compared to other dashboards, tablespace monitoring is added, which can be expanded to set tablespace alarms;
Credits:
Based on https://grafana.com/grafana/dashboards/11121
Note: I translated chinese labels to english and fixed tablespace usage stats which was broken since grafana 7.0 (grafana removed 'timeseries_to_rows' in v7.0 which was fixed by applying following transformations:
- "Label to fields" (Leave value field option empty)
- "Group by" (Set 'tablespace' to 'Group by' and value to 'Calculate' (Last (not null)))
Prerequisites: oracle db, prometheus, oracledb-exporter
oracledb-exporter https://github.com/iamseth/oracledb_exporter
Running oracledb-exporter
- Please check documentation at https://github.com/iamseth/oracledb_exporter
Ensure that the environment variable DATA_SOURCE_NAME is set correctly before starting.
Since oracledb-exporter relies on oracle instantclient, you might also need to set LD_LIBRARY_PATH environment variable to instantclient location, i.e.:
export LD_LIBRARY_PATH=/home/DEV/plugins/instantclient_21_1:$LD_LIBRARY_PATH
(if you get errors like oracledb_exporter: error while loading shared libraries: libclntsh.so)
There is also a docker image which provides oracledb-exporter: https://hub.docker.com/r/iamseth/oracledb_exporter
To run docker image:
docker pull iamseth/oracledb_exporter
docker run -d --name oracledb_exporter --restart=always -p 9161:9161 -e DATA_SOURCE_NAME=[db_user]/[db_passwd]@[db_ip]:[db_port]/[SID] iamseth/oracledb_exporter
Check http://localhost:9161/metrics after running to verify metrics are up
Prometheus config to scrape logs from oracledb-exporter
scrape_configs:
- job_name: 'oracle_metrics'
scrape_interval: 5s
static_configs:
- targets: ['localhost:9161']
Data source config
Collector config:
Upload an updated version of an exported dashboard.json file from Grafana
| Revision | Description | Created | |
|---|---|---|---|
| Download |
Oracle Database
Monitor Oracle Database with Grafana. Easily monitor your Oracle Database deployment with Grafana Cloud's out-of-the-box monitoring solution.
Learn more

